Introduction
Type 2 Diabetes Mellitus is a disease spectrum which encompasses a common phenotype of hyperglycemia.1, 2, 3 Over the years, the disease has spread worldwide and the prevalence of diabetes is rising.4 In a previous study we found that there is definite positive correlation with the total oxidative stress and plasma glucose level and a negative correlation between the TAD and plasma glucose in diabetic patients.5 The challenge of net total oxidative stress after partially counteracted by the TAD has a cumulative effect with the continuous inflammatory process in diabetic patients and act for the causation of its complications. 5
Ferritin is an acute phase reactant and an established marker of acute and chronic inflammation. It shows a non-specific elevation in a variety of inflammatory conditions. 6, 7 Simultaneously ferritin also reflects the iron reserve in the body. A number of researchers have verified that patients with diabetes show iron overload in varying degrees, and excess iron adds on to the insulin resistance encountered in type-2 Diabetes. 8, 9
Aims and Objectives
The aim of the study is to find out whether there is any imbalance between antioxidant defense and oxidative stress as well as serum ferritin levels in cases in comparison to clinically and biochemically healthy controls.
Background
In the past few year different researchers have used different methods for the assay of total oxidative stress and antioxidant status in different body fluids in their studies. For estimation of oxidative stress they have assayed products of oxidative damage such as thiobarbituric acid reactive substances. To assay the antioxidant defense antioxidant components such as catalase, glutathione peroxidase, superoxide dismutase were measured. 10 The total antioxidant status of our body has a day-to-day variation either due to overload of free radicals generated or by fluctuations in intake of dietary antioxidants or antioxidant supplements. Accepted reference ranges of normal levels and interpretations of the values in different diseases are also lacking as well as there is lack of quality control materials. So it is necessary to find out some assay procedures that can measure cumulatively total oxidative stress and antioxidant defense in body fluids so that a basic scale of index may be made to grade the levels of oxidative damage. 5
Ferritin is a 24 subunit protein present in almost all tissues mainly in cytoplasm, though a mitochondrial form has been described. 11, 12 Ferritin plays a very important role in the storage of intracellular iron, and serum ferritin level has been the subject of recent research. 11, 12, 13, 14 Ferritin has two types of subunits, referred to as H and L subunit. Serum ferritin levels are nonspecifically raised in different inflammatory conditions like acute infections, collagen vascular diseases and diseases with autoimmune etiology. 15 Diabetes mellitus is related to chronic inflammatory state and it has autoimmune etiology also. The main organ behind body iron homeostasis is liver. Several iron related genes are synthesized in liver like transferrin receptor 2 gene, transferrin gene, hormone hepcidin gene which can alter the levels of iron, transferrin and ferritin when there is alteration in liver function.16, 17, 18 Previous researches elucidated that type-2 Diabetes Mellitus causes overload of iron due to the down-regulation of hormone hepcidin gene. However, whether there is decreased level of transferring receptor 2 gene with increased level of serum ferritin is yet to be ascertained. 19 The exact role of ferritin as a marker of iron overload in causing damage to pancreatic cells or causing insulin resistance is not understood yet. 20
Materials and Methods
The assay of serum TOS, TAD and serum ferritin was carried out in human subjects. Forty patients suffering from type-2 Diabetes Mellitus were recruited in our study, with their age between 20 to 50 years, and equal number of controls with glycemic status in normal reference range, of the same age group were enrolled. The study was conducted after getting approval from the Institutional Ethics Committee, NRS Medical College, Kolkata, India in a period of six months in 2015. This study was done as a pilot project in extension to a study on the levels of TOS, TAD and hydrogen sulfide levels in type-2 Diabetes patients. Patients suffering from other endocrine disorders like thyroid disorders, renal failure, patients on antioxidant therapy were excluded. Collection of sample: 5ml of whole blood was drawn aseptically and 3ml taken in polystyrene tubes with clot activator and 2ml in fluoride vials, centrifuged for 5 minutes. The serum separated was used for estimation of ferritin, TAS, TOD and 2ml fluoride-plasma was used to estimate fasting plasma glucose.
Total oxidative stress (TOS) and total antioxidant defense (TAD) - Assay methods
Estimation of total oxidative stress in serum:5, 21, 22 principle
The reaction is based on breaking of hydroperoxides into alkoxyl and peroxyl radicals by iron acting as catalyst. Radicals generated react with the chromogen (N,N-dimethyl- p-phenylenediamine sulphate) and form a colored compound and the absorbance of the final product may be read in an instrument operating on Lambert-Beer’s law. So the oxidative status of the sample can be calculated from the value of this absorbance. Initially a calibration curve was constructed (published earlier) using different concentrates of hydrogen peroxide (H2O2milimol/L) and Δ absorbance measured at 505nm in a six-minute time-scan between 6th and 4th minute. Δ absorbance corresponds to the value of oxidative stress.
Assay procedure
100 microliters serum was diluted to 20 times with Phosphate Buffered Saline, and this amount was dissolved in 1000 microliter of acetate buffer. 25 microliters of chromogen was mixed and its absorbance was obtained at 505nm by 6 min time-scan in UV-VIS spectrophotometer. Δ absorbance obtained at 4 to 6 minutes for each sample against blank, were compared to the calibration curve already constructed using hydrogen peroxide.
Estimation of total antioxidant defense (TAD) in serum: 5, 21
Principle:In a medium of pH 5.2 using an oxidant ferric chloride, the chromogen (N, N-dimethyl- p- phenylenediamine sulphate) gets converted to a colored radical cation that is detected at 505 nm at 37° C. Compounds having antioxidant activity present in the sample causes reduction of the radical cation. The color of radical cation is quenched and this decreases the color of solution. This reduction in color is proportional to the concentration of antioxidants present in the sample. The readings of absorbance obtained in the spectrophotometer are compared with a calibration curve obtained using Trolox(a water soluble form of tocopherol) with absorbance values taken at 505nm.
Assay procedure
Acetate buffer was taken in a test tube. 25 microliter chromogen and 10 microliter of ferric chloride solution added in the tube. Serum is diluted twenty times.10 microliter diluted serum was then mixed with the solution mixture. Antioxidants present in the serum quench the colored cation and causing decrease in the color of the solution. This gives a decrease in absorbance values which is directly proportional to the antioxidants activity of sample. Calibration curve of TAD estimation was constructed by taking different concentration of trolox, having strong antioxidant activity which causes discoloration of the chromogenic radical maximally between 4th and 6th minute. With different concentrations of this known antioxidant, the decrease (ΔA4-A6) in values of absorbance at 505nm between 4th and 6th minute was plotted. For the serum samples the antioxidant status was expressed in equivalents of trolox extrapolated from the calibration curve.
Assay of serum ferritin levels and other parameters
Serum ferritin was assayed in standardized ELISA kits using ELISA reader and washer. Other biochemical parameters like glucose level in blood was estimated by Glucose oxidase - Peroxidase method by standardized kit using full automated Biochemistry analyser after running two levels of external quality control product.
Results
Table 1
Demographic and biochemical parameters of the study:
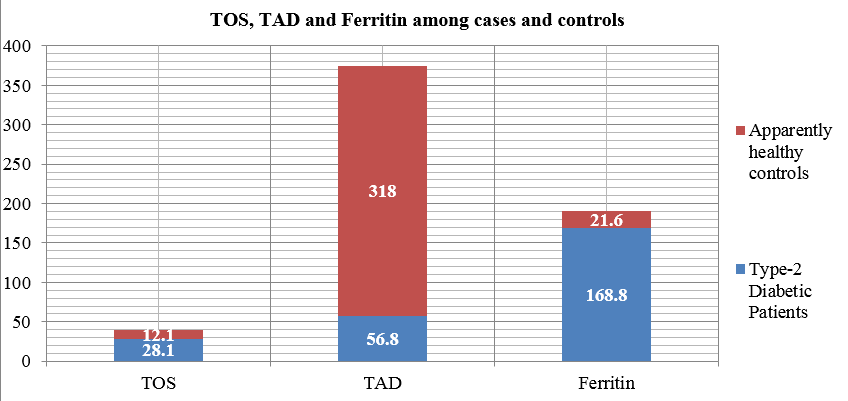
Among the age and sex matched cases and controls in our study the mean value of fasting plasma glucose level of recently diagnosed diabetic patients is 179.3 ± 27.8 mg/dl which is significantly higher than that of the apparently healthy controls which is 79.1 ± 12.3 mg/dl (p<0.05). It has been observed that mean value of TOS in patients is 28.1 ± 11.4 milimol of H2O2 /L and this is significantly increased than the mean of the TOS values of the controls which is 12.1 ± 4.4 milimol of H2O2 /L (p<0.001). From the Table 1, it is evident that the mean of the TAD values of patients 56.8 ± 12.1 milimol/L equivalent of trolox is significantly lower than the controls 318 ± 83.4 milimol/L equivalent of trolox. Similarly, the mean value of serum ferritin of patients is 168.8 ± 32.7 μg/L which is also significantly increased than that of the controls (21.6 ± 8.6 μg/L).
Figure 1
Mean values of TOS, TAD and ferritin in serum of recently diagnosed diabetic patients and apparently healthy controls.

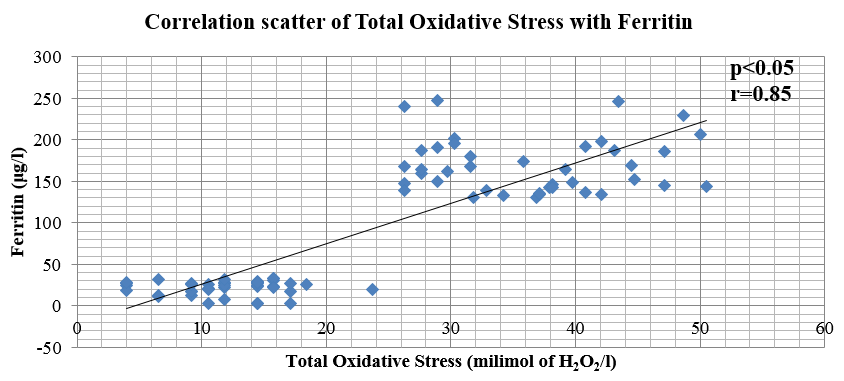
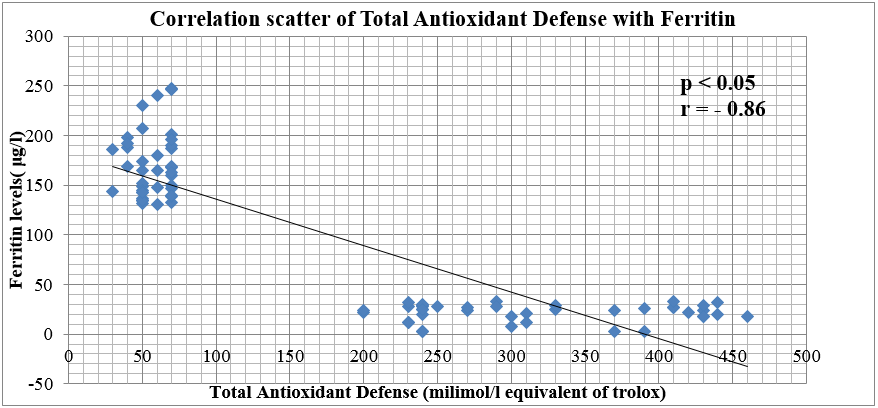
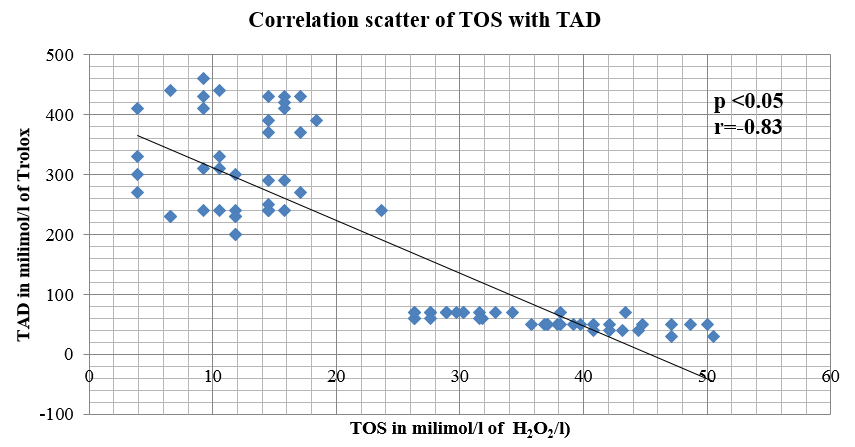
In our study, it has been observed that there is a strong positive correlation (r = 0.85) between the TOS values of cases and controls when compared with the values of serum ferritin levels and a strong negative correlation between TAD and Ferritin (r = -0.86).Values of TOS bears a negative correlation with the values of TAD (r= -0.83) .
Figure 2
Graphical plot of the correlation between total oxidative stress and ferritin levels in serum of recently diagnosed diabetic patients and apparently healthy controls

Discussion
It has been an established fact that oxidative stress plays key role in causation and progression of Diabetes Mellitus.23, 24, 25 Researchers have reported in different journals that the disease itself and its microvascular complications are result of imbalance between higher oxidative stress with lower antioxidant activity.26 The toxic free radicals which are not detoxified are important factor in the causation of diabetic complications.27, 28, 29 High serum ferritin level has been reported among T2DM patients with irregular glycemic control. However, increased serum ferritin levels has been observed among T2DM patients with good glycemic control as compared to normal ferritin levels detected in the non-diabetic control group.30 In our study, the total oxidative stress(TOS) values are significantly higher among cases than the control group. On the contrary, the total antioxidant defense (TAD) values are significantly decreased than the TAD values in the control group. The values of serum ferritin of recently diagnosed patients suffering from type-2 Diabetes are significantly elevated than the serum ferritin levels of the apparently healthy controls. These findings are in unison with the above mentioned findings by other previous researchers. In diabetic cases and controls, the fact that TOS and TAD values have inverse relationship, has been corroborated in this study also. The significant finding in the study is that the levels of serum ferritin have shown strong positive correlation with the values of TOS and negative correlation with the TAD values. With these two significant correlations, it can be predicted that serum ferritin can give a rough idea about the net total oxidative status. Even though TOS, TAD are simple colorimetric tests, but in all clinical biochemical laboratories the reagents are not available. So, if serum ferritin which is an acute positive phase reactant and often prescribed frequently by clinicians can be assayed, then this can give a rough idea of the net oxidative status of diabetic patients. This serum ferritin along with TOS and TAD can have a predictive value of the oxidative status of a patient which may predict the outcome of the disease and predict the chance of development of microvascular complications.
Conclusion
The positive correlation of values of TOS with the values of serum ferritin and the negative correlation of the values of TAD with serum ferritin levels have been observed in our study. Instead of estimation of TOS, TAD by two different tedious methods, serum ferritin can be estimated as predictive markers of the oxidative status of diabetic patients.


