Journal of International College of Dentists
Journal of International College of Dentists (JICD) is an open-access, peer-reviewed, Quarterly journal publishing under the auspices of the International College of Dentists. As soon as the Article is accepted for Publication, it will be placed in “Ahead of Print” on the journal page with the aim of rapid and better knowledge dissemination. In addition, the journal allows free access (Open Access) to its contents, which is likely to attract more readers and citations to articles published in journal. Manuscripts must be prepared under the “Uniform requirements” of the ...
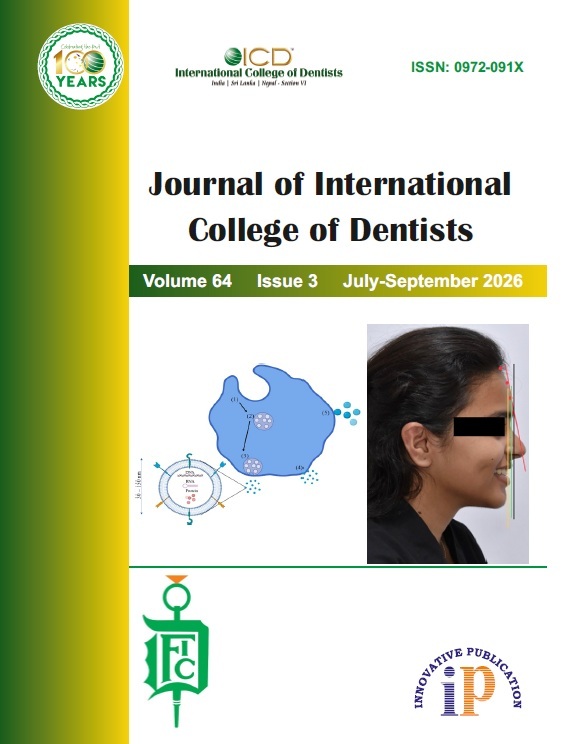
Soft tissue parameters evaluation in average growth pattern subject in Mithilanchal population
Abstract
Aim and Objectives: The study aimed to evaluate and correlate lower anterior facial height with soft tissue characteristics among individuals exhibiting different vertical facial growth patterns.
Materials and Methods: A total of 128 Indian adults aged 18–30 years were included in the study. Standardized lateral cephalometric radiographs were obtained for all participants. Based on their vertical facial growth patterns, the subjects were classified into three groups: horizontal, average, and vertical facial types. Fourteen linear measurements were recorded from each radiograph to assess skeletal and soft tissue characteristics. The measurements were analyzed to determine the relationship between lower anterior facial height and associated soft tissue parameters across the three groups.
Results: Statistically significant differences were observed in upper lip thickness (Ls–U1), soft tissue thickness at Point B, lower lip height (St–Ils), lower soft tissue facial height (Sn–Ms), and lower anterior facial height (ANS–Me). These findings indicated variations in facial soft tissue dimensions among individuals with different vertical growth patterns.
Conclusion: The study demonstrated that facial soft tissue characteristics, particularly vertical facial parameters, are influenced by the underlying skeletal growth pattern. Assessment of these relationships may be useful in orthodontic diagnosis, treatment planning, and evaluation of facial proportions.
1. Introduction
Orthodontic treatment aims to enhance both functional occlusion and facial appearance. The shape and beauty of the mouth greatly influenced the harmony and balance of the facial features. Beauty has remained a topic of fascination and importance across civilisations, despite varying definitions over time.[1]
Proper proportions between facial structures are essential for a pleasing and attractive appearance. Orthodontic diagnosis is shifting from hard tissue examination to soft tissue evaluation. Soft tissue can develop out of proportion to underlying skeletal elements while remaining balanced and harmonious. The soft tissue is based on the relationships between the skeleton and the teeth.[2][3] Nonetheless, a harmonious foundation does not imply that the facial tissue above it will also be harmonious and attractive.[4][5]
The soft tissue outline plays a significant role in overall facial appearance, as it reflects the underlying facial skeleton. Achieving facial harmony and functional occlusion requires understanding craniofacial growth and the impact of treatment on the soft tissue profile. Soft tissue changes with growth have been studied using cross-sectional, semi-longitudinal, and longitudinal approaches.[6] Factors such as ethnicity, age, gender, and cultural background influence soft tissue thickness, making it essential to evaluate both hard and soft tissues during diagnosis and treatment planning. The interrelationship between features like the nose, lips, and chin evolves during growth and orthodontic intervention.
Combined orthodontic and orthognathic treatment is often needed to achieve Class I occlusion and facial harmony. Orthognathic surgery aligns skeletal, dental, and soft tissue structures for improved function and esthetics.[7] Lateral cephalometric radiographs have been instrumental in analyzing soft tissue profiles due to their significant role in facial appearance. Facial esthetics depends on skeletal morphology, incisor positioning, and soft tissue harmony. These factors guide treatment strategies that either enhance facial fullness or camouflage skeletal discrepancies. STFP (Soft Tissue Facial Profile) analysis has emerged in orthodontic diagnostics, particularly in cases with skeletal malocclusion.[8] In some cases, soft tissue compensation can mask skeletal issues, allowing for more conservative treatment approaches.
There is variation in soft tissue thickness based on malocclusion class and gender. Class III cases often show increased thickness in the sub nasal and upper lip regions, while Class II cases have thicker lower lip tissues. Similar patterns have been observed in growing patients. Studies also show that adult males tend to have thicker soft tissues than females, and facial soft tissue tends to thicken with age. However, comparisons between children and adults remain limited, and the relationship between hard and soft tissue parameters continues to be explored.[9]
2. Materials and Methods
128 skeletal Class I lateral head cephalograms of developing subjects between the ages of 18 and 30 were used in this cross-sectional study, which had the following inclusion criteria:[5][6][7] Bilateral Angle Class I molar relation with normal overjet/overbite (0–2 mm). Class I skeletal jaw bases. Average growth pattern based on FMP, Sn-Go-Gn, Y-axis. Full permanent dentition (2nd molar to 2nd molar) with normal alignment. Relaxed lip position.
Cephalometric analysis was conducted using 12 parameters (8 linear and 4 angular), who visited the outpatient department at Mithila Minority Dental College and Hospital, Darbhanga. Acetate tracing sheets were used to trace the lateral head cephalograms. In the event that the left and right structural outlines could not be superimposed on one another, the cephalometric points were identified using the arbitrary line that resulted from a comparison of the two. The measurements were taken to the closest 0.5° for the angle and 0.5 mm for the linear. Landmarks identified per Nanda, Downs, Broadbent, Rakosi, Holdways, Burstone, and Steiner.[10][11][12]
The parameters are listed below:
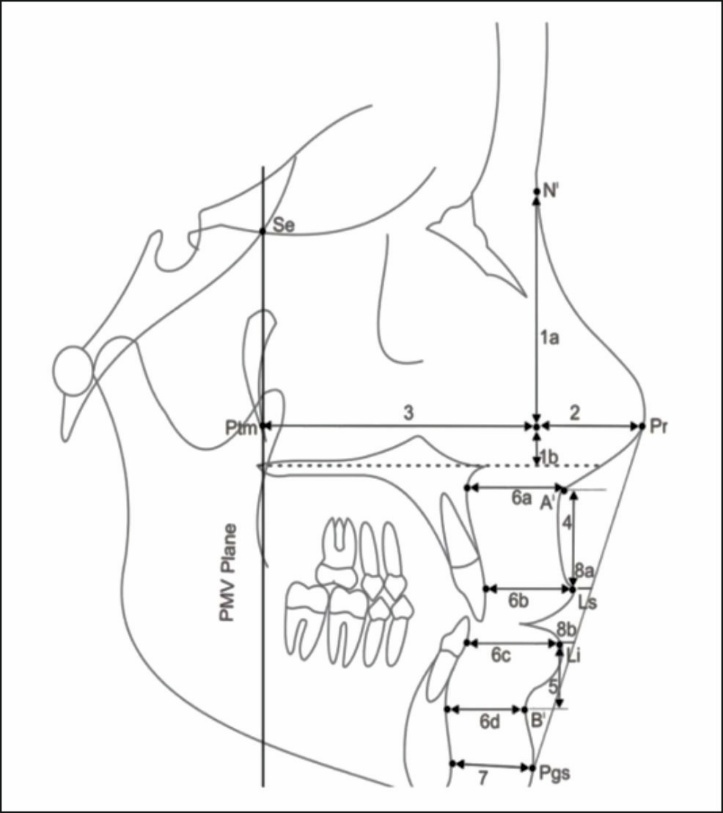
2.1. Linear parameters (Figure 1)
Nose height: Upper nose height (N|-Prn|), Lower nose height (Prn|- ANS||). Nose depth (Prn|-Prn|). Sagital depth (Prn|-PMV plane). Upper lip height (A|- Vermilion border of upper lip). Lower lip height (B|- Vermilion border of lower lip). Thickness of lip: The thickness of the lips at point A (A- A|), Thickness of lips at Laberale Superius (Ls|-Ls), Thickness of the lips at Laberale Inferius ( liLi|-Li), Thickness of the lips at B point (B-B|). Soft tissue chin thickness( Pgs - Pg|). Measurement of lip to esthetic plane: E plane to upper lip (E plane- Vermilion border of upper lip), E plane to lower lip (E plane- Vermilion border of lower lip).
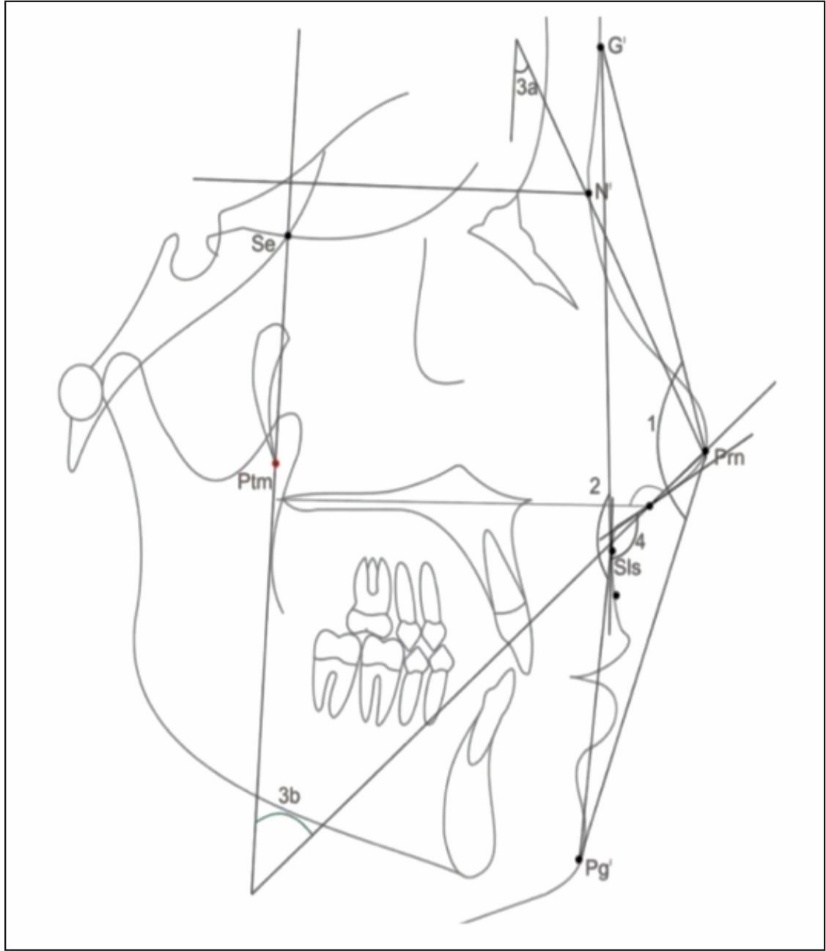
2.2. Angular parameters (Figure 2)
Angle of the nose and the overall convexity of the face (GI|-Prn- Pg|). Convexity angle of the face without the nose (GI|-Sis- Pg|). Nose inclination: Upper (PMV-N|-Prn), Lower (PMV- Ans|-Prn), Nasolabial angle (columella tangent-upper lip tangent).
3. Statistical Analysis
The mean ± standard deviation was used to summarize the collected data. After the Shapiro-Wilk test showed normality and the Levene's test determined homogeneity of variances, A two-way ANOVA was used to compare the groups, and Tukey's post hoc test was used to determine whether the mean difference within and between the groups was significant.
A two-tailed (a = 2) p < 0.05 was considered a statistically significant result. SPSS 17.0 was used to conduct the analyses.
4. Results
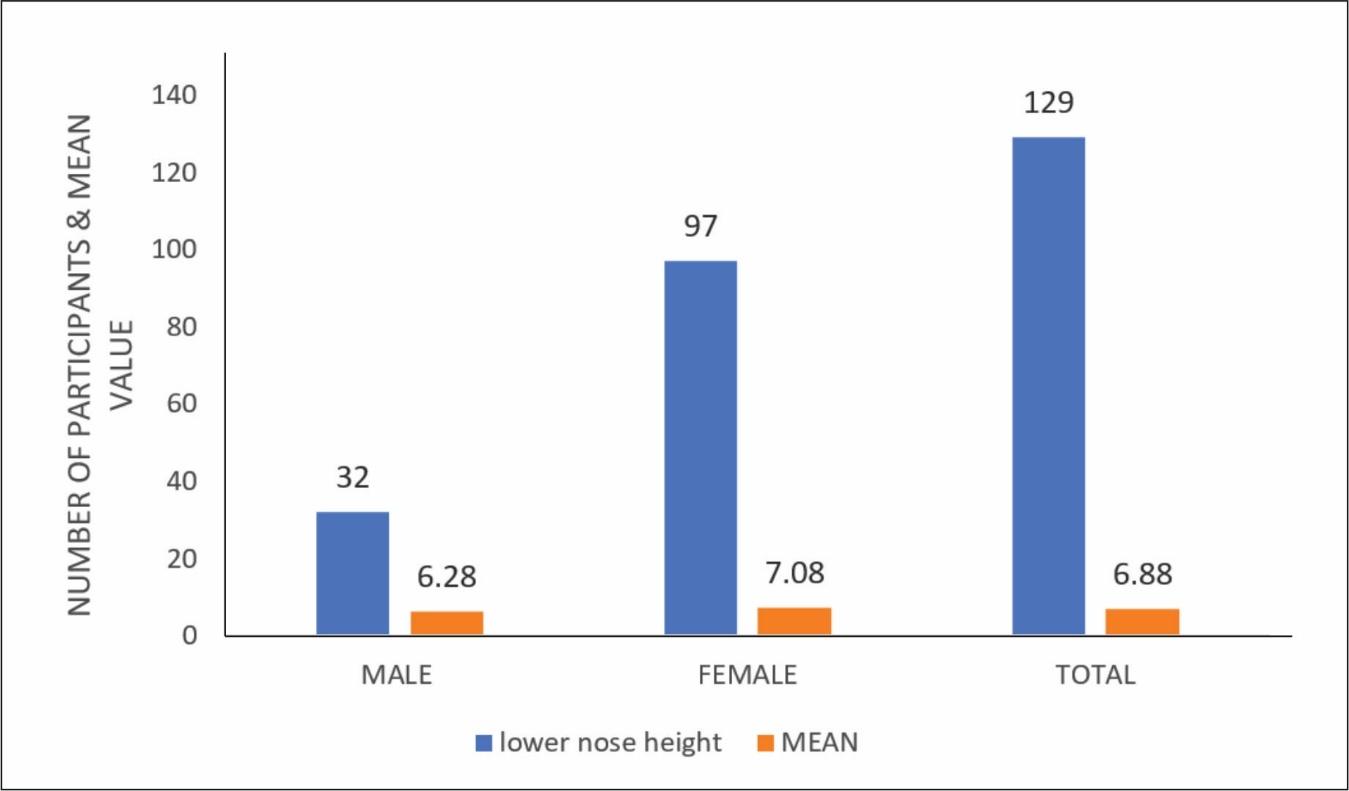
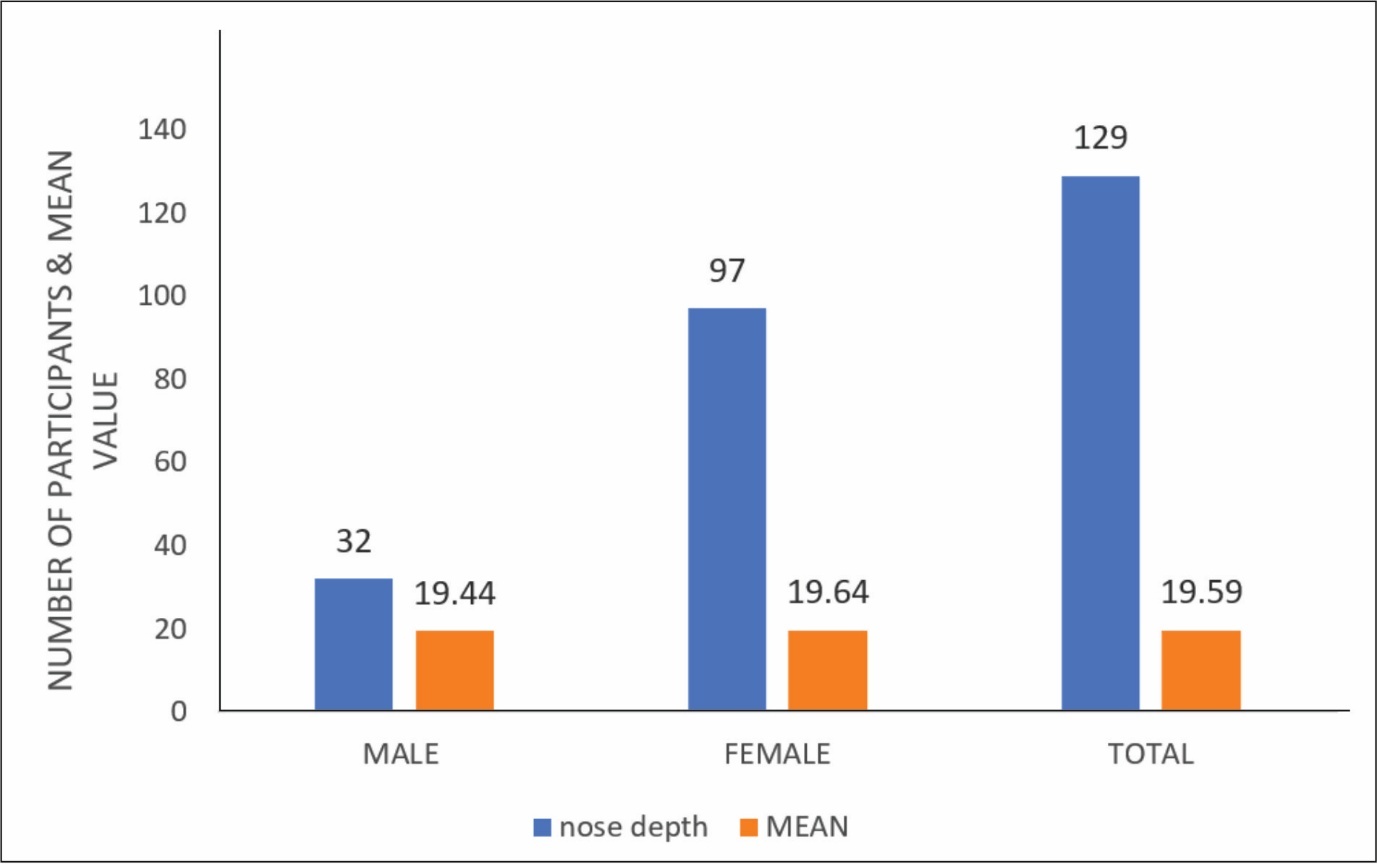
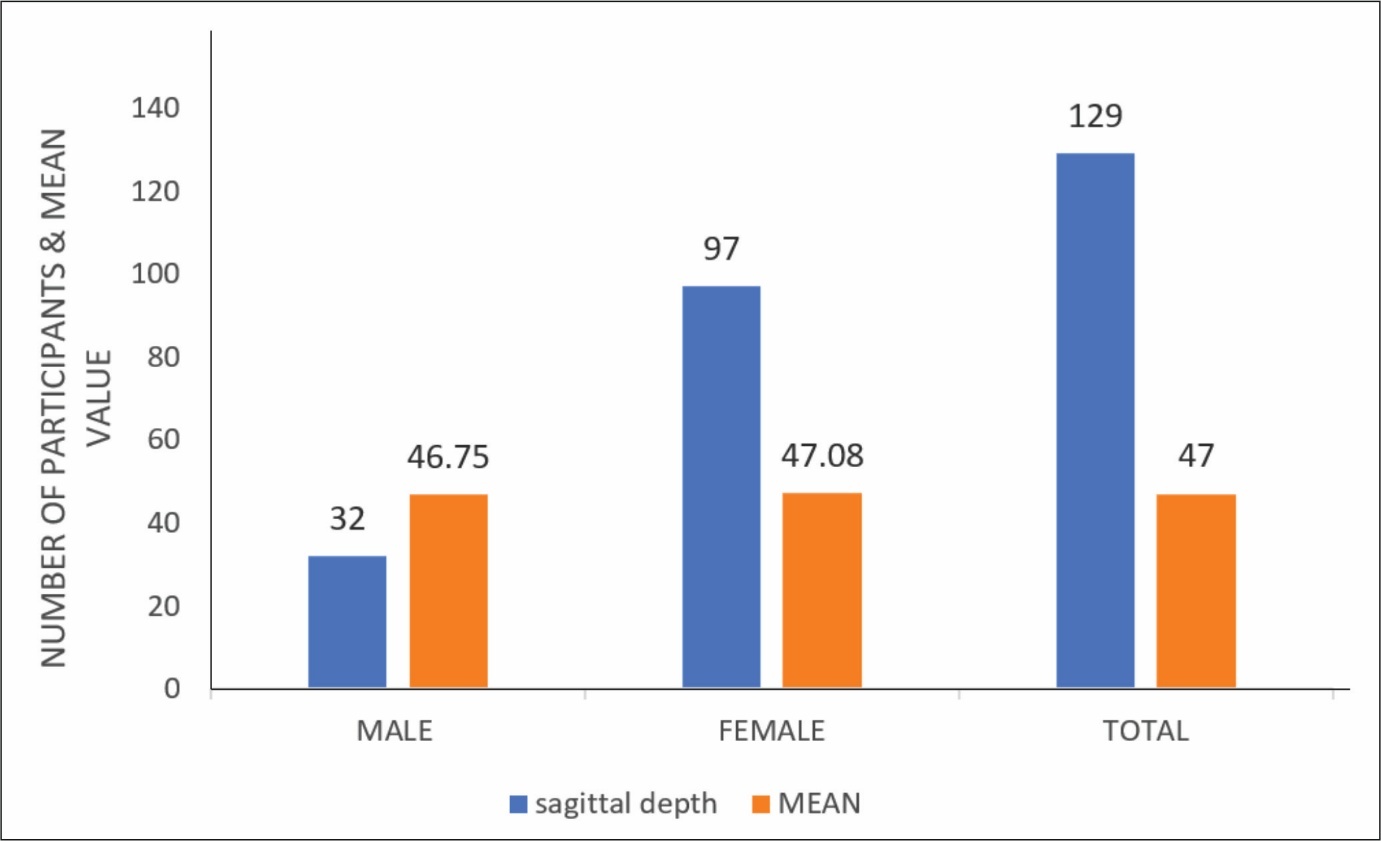
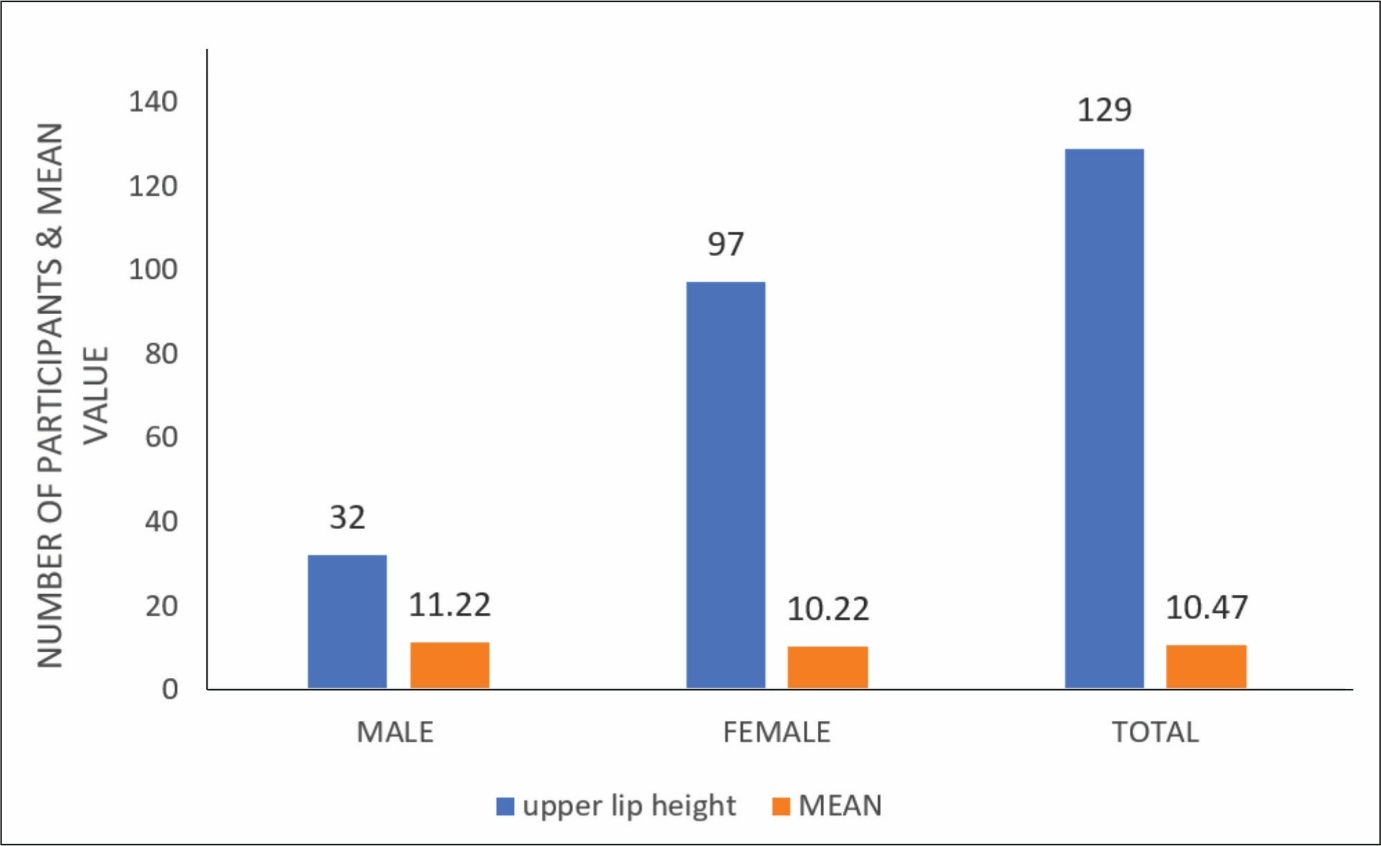
This study presents a comparison of soft tissue parameters across various age groups utilizing ANOVA. The analysis reveals statistically significant differences (p ≤ 0.05) in several measurements, including upper nose height, lower nose height, upper lip height, lip thickness at A point, soft tissue chin thickness, the distance from the upper lip to the E plane, the distance from the lower lip to the E plane, upper nose inclination, lower nose inclination, nasolabial angle, nose depth, sagittal depth, lower lip height, lip thickness at labrale superius, lip thickness at B point, as well as the angular measurements of total facial convexity, both including and excluding the nose. ([Table 1])
|
Parameter |
Gender Difference (p ≤ 0.05) |
Age Difference (p ≤ 0.05) |
|---|---|---|
|
Upper Nose Height |
Yes |
Yes |
|
Lower Nose Height |
Yes |
Yes |
|
Nose Depth |
No |
Yes |
|
Sagittal Depth |
No |
Yes |
|
Upper Lip Height |
Yes |
Yes |
|
Lower Lip Height |
No |
Yes |
|
Lip Thickness at A Point |
Yes |
Yes |
|
Lip Thickness at Labrale Superius |
No |
Yes |
|
Lip Thickness at Labrale Inferius |
No |
Yes |
|
Lip Thickness at B Point |
No |
Yes |
|
Soft Tissue Chin Thickness |
Yes |
Yes |
|
Upper Lip to E Plane |
Yes |
Yes |
|
Lower Lip to E Plane |
Yes |
Yes |
|
Total Facial Convexity (Including Nose) |
No |
Yes |
|
Facial Convexity (Excluding Nose) |
No |
Yes |
|
Upper Nose Inclination |
Yes |
Yes |
|
Lower Nose Inclination |
Yes |
Yes |
|
Nasolabial Angle |
Yes |
Yes |
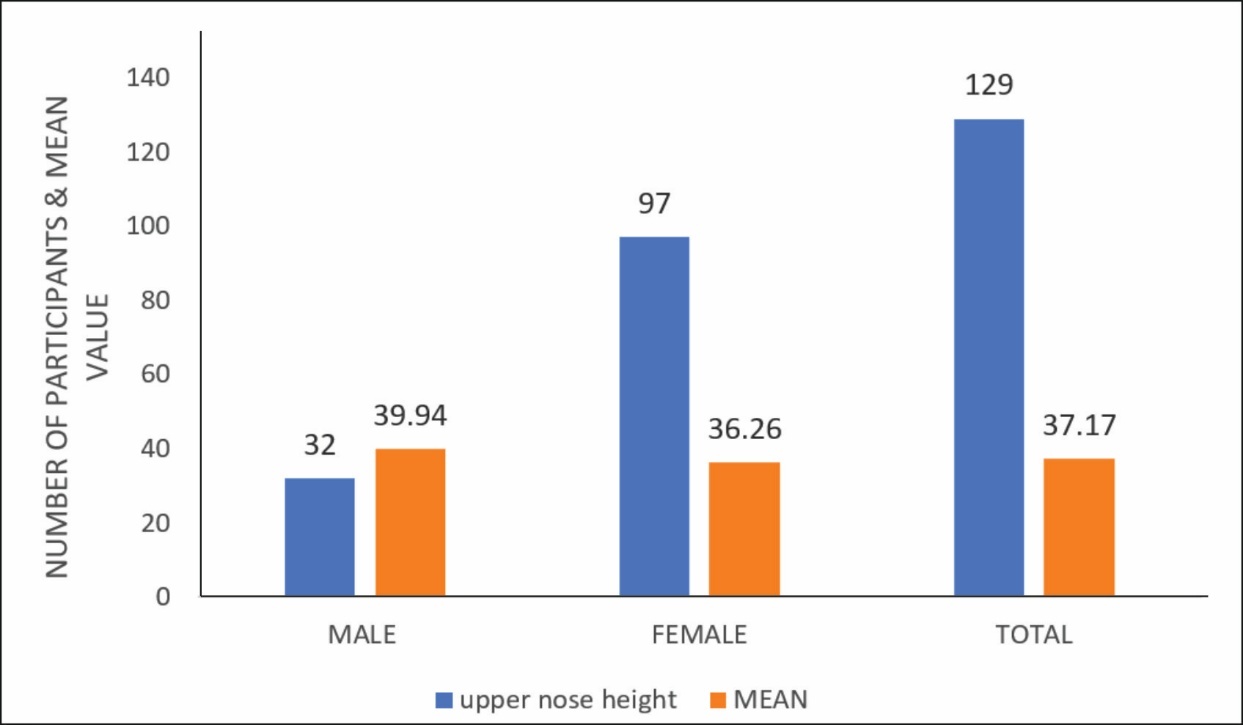
No significant gender differences were found in characteristics such as nose depth, sagittal depth, lower lip height, lip thickness at labral superior and B point, and face convexity angles. Age-based analysis revealed significant variations in soft tissue parameters (p ≤ 0.05), indicating developmental changes. Upper and lower nose height, lip measurements, and nose inclinations varied significantly across age groups, especially in late teens to late 20s. These findings highlight the necessity of taking gender and age into account when doing craniofacial examinations and therapies. (Graph 1,2,3,4,5)
5. Discussion
In the current investigation, we utilised the pterygomaxillary vertical (PMV) plane as the reference plane. Researchers including Burstone, Subtelny, Sarnas, and Vig and Cohen utilised the palatal plane as a reference for vertical and sagittal tissue measurements. Conversely, authors such as Brodie, Ricketts, and Mamandras observed that while the palatal plane is generally stable, its angulation can fluctuate, and orthodontic treatment may modify its position.[13][14]
To examine alterations in the soft tissue profile, a stable and reproducible reference plane is required, with both the pterygomaxillary (ptm) and sphenoethmoidal (se) points considered rather stable during growth. Enlow observed that the PMV plane is nearly perpendicular to the line of sight and aligns with the anatomically neutral position of the head.[15]
Movement of the face musculature might influence the length and thickness of soft tissues, especially in the lips and chin. These findings, however, demonstrate consistency despite considerable variety Significant variations in soft tissue measurements were expected, as alterations in posture and at each age and orientation of these measurements, whether aligned with the vertical plane parallel to the PMV plane or along a plane perpendicular to the PMV plane, thereby ensuring stability.[16]
The PMV plane was chosen for this study due to its improved stability and reproducibility compared to other soft tissue and skeleton planes.
5.1. Nose height
We discovered that the height of the nose increased with age, and the increase in the height of the upper nose was observed to be larger in males compared to females. The elevation of lower nose height also augmented with age, with a more pronounced increase observed in the female subgroup. This is attributable to the development of the nasal bone and the surrounding soft tissue. As age progresses, nasal growth alters in both size and shape after the age of 13, with males exhibiting a bigger nasal bone component than females.[17]
5.2. Nose depth
Both increased with age but showed no statistical significance; males had higher sagittal depth. This increment was found nonsignificant. Nose Sagittal depth- As ageing progresses, a rise in sagittal depth is observed. This results from the development of the nasal bone and the adjacent soft tissue in both vertical and anteroposterior dimensions; no sexual dimorphism was noted in sagittal depth or nasal depth.
5.3. Lip thickness
In addition to length, provides a unique perspective on lip growth. In this study, we assessed upper and lower lip thickness at four distinct sites since variability in thickness of upper and lower lips can impact the degree of facial convexity. On evaluation, mean value for these parameters was higher in males as compared to females and lip thickness increased in both subgroups with age. We also found that this increase was greater at point A and point B than vermilion borders.
5.4. Soft tissue chin thickness
Both male and female categories experienced considerable growth increments. This finding could be attributed to alterations in hard tissue chin growth and increased thickness of soft tissue covering.
5.5. Measurements of lips to esthetic plan
The upper and lower lips were posterior to the aesthetic plane, with negative distances and positive distances in an anterior position. Our investigation examined the distance between the upper and lower lips to the E-plane. Observing these values, we found that both upper and lower lips were positioned ahead to the aesthetic plane, except for the upper lip in males, while females placed them behind the aesthetic plane.
5.6. Angular parameters
Angle of entire facial convexity, including the nose. Males had a greater mean value than females, and both genders had a decline in total facial convexity, including the nose, as they grew older. Males experienced a greater decline as they aged.
6. Conclusion
Males showed higher values for all the parameters than females, and all the parameters increased in dimension with growing, except for the angle of whole face convexity, which includes the nose, and the nasolabial angle, which decreased in measurement.
7. Source of Funding
None.
8. Conflict of Interest
None.
9. Ethical Approval
The following study was approved by the Institutional Ethics Committee of Mithila Minority Dental College and Hospital, Darbhanga, Bihar, India (dated on 23rd, March, 2023); letter of recommedation was provided by the Institutional Ethics Committee.
References
- Bagwan AA, AL-Shennawy MI, Alskhawy MM. Evaluation of soft tissue parameters for adults with accepted occulusion using Legan and Burstone analysis. Tanata Dent J. 2015;12(1):1-6. [Google Scholar] [Crossref]
- Bishara SE, Jakobsen JR, Hession TJ, Treder JE. Soft tissue profile changes from 5 to 45 years of age. Am J Orthod Dentofacial Orthop. 1998;114(6):698-706. [Google Scholar] [Crossref]
- Kumar A, Tandon P, Singh GK, Singh GP. Soft tissue growth changes from 8–16 years of age: A cross-sectional study. Natl J Maxillofac Surg. 2019;10(2):161-167. [Google Scholar] [Crossref]
- Aggarwal I, Soni T, Mittal S, Bhullars MK, Palkit T, Chatwalia S. Evaluation soft tissue cephalometric evaluation using Holdaway analysis in district Solan population. Univ J Dent Sci. 2021;7(2):8-15. [Google Scholar] [Crossref]
- Kumar AA, Parthiban P, Kumar SS, Divakar G, Sekar SS, Silambu MR. Assessment and Evaluation of Soft Tissue Measurements between Various Mandibular Divergences in the South Indian Population: A Cephalometric Study. J Pharm Bioallied Sci. 2022 Jul;14(Suppl 1):S152-S155. [Google Scholar] [Crossref]
- Girhe V, Borle R, Datey P, Shirivastav S, Bhola N. Cephalometric norms for the north Indian population: A systematic review. Natl J Maxillofac Surg. 2022;13(2):172-179. [Google Scholar] [Crossref]
- Sachan A, Srivastav A, Chaturvedi TP. Soft-tissue cephalometric norms in a north Indian ethnic population. J Orthod Sci. 2012;1(4):92-97. [Google Scholar] [Crossref]
- Abdulal G, Osman A, Abyad A. Evaluation of Facial Soft-Tissue Morphology among Different Vertical Skeletal Profile. Eur Sci J. 2022;18(11):117. [Google Scholar] [Crossref]
- Arnett GW, Gunson MJ. Facial planning for orthodontists and oral surgeons. Am J Orthod Dentofacial Orthop. 2004;126(3):290-295. [Google Scholar] [Crossref]
- Holdaway RA. A soft-tissue cephalometric analysis and its use in orthodontic treatment planning. Part I. Am J Orthod. 1983;84(1):1-28. [Google Scholar] [Crossref]
- Arnett GW, Jelic JS, Kim J, Cummings DR, Beress A, Worley CM Jr, et al. Soft tissue cephalometric analysis: diagnosis and treatment planning of dentofacial deformity. Am J Orthod Dentofacial Orthop. 1999;116(3):239-253. [Google Scholar] [Crossref]
- Kiełczykowski M, Kamiński K, Perkowski K, Zadurska M, Czochrowska E. Application of Artificial Intelligence (AI) in a Cephalometric Analysis: A Narrative Review. Diagnostics (Basel). 2023;13(16):2640. [Google Scholar] [Crossref]
- Hamid S, Abuaffan AH. Facial soft tissue thickness in a sample of Sudanese adults with different occlusions. Forensic Sci Int. 2016;266:209-214. [Google Scholar] [Crossref]
- Gungor K, Bulut O, Hizliol I, Hekimoglu B, Gurcan S. Variations of midline facial soft tissue thicknesses among three skeletal classes in Central Anatolian adults. Leg Med (Tokyo). 2015;17(6):459-466. [Google Scholar] [Crossref]
- Sahin Sağlam AM, Gazilerli U. Analysis of Holdaway soft-tissue measurements in children between 9 and 12 years of age. Eur J Orthod. 2001;23(3):287-294. [Google Scholar] [Crossref]
- Ward RGD. Cephalometric. Evaluation of Soft Tissue Effects Induced By a Class II Corrector in Different Facial Patterns (Research). Canada: The University of Manitoba; 2014. [Google Scholar] https://mspace.lib.umanitoba.ca/server/api/core/bitstreams/65c4ee9c-89e7-49e0-9145-757adef01b31/content
- Sahoo N, Mohanty R, Mohanty P, Nayak T, Nanda SB, Garabadu A. Cephalometric norms for East Indian population using Burstone Legan analysis. J Int Oral Health. 2016;8(12):1076-1081. [Google Scholar] [Crossref]
- Abstract
- 1. Introduction
- 2. Materials and Methods
- 3. Statistical Analysis
- 4. Results
- 5. Discussion
- 5.1. Nose height
- 5.2. Nose depth
- 5.3. Lip thickness
- 5.4. Soft tissue chin thickness
- 5.5. Measurements of lips to esthetic plan
- 5.6. Angular parameters
- 6. Conclusion
- 7. Source of Funding
- 8. Conflict of Interest
- 9. Ethical Approval
- References
Article Metrics
- Visibility 107 Views
- Downloads 131 Views
- DOI 10.18231/j.jicd.59237.1792216568
-
CrossMark

- Citation
- Received Date June 14, 2025
- Accepted Date September 18, 2026
- Publication Date October 17, 2026