Panacea Journal of Medical Sciences
Panacea Journal of Medical Sciences (PJMS) open access, peer-reviewed triannually journal publishing since 2011 and is published under auspices of the “NKP Salve Institute of Medical Sciences and Research Centre”. With the aim of faster and better dissemination of knowledge, we will be publishing the article ‘Ahead of Print’ immediately on acceptance. In addition, the journal would allow free access (Open Access) to its contents, which is likely to attract more readers and citations to articles published in PJMS.Manuscripts must be prepared in accordance with “Uniform requiremen...
Correlation between atopic eczema, total eosinophil counts and serum IgE - A case-control study
Abstract
Background: Atopic eczema (AE) is a pruritic, chronically relapsing inflammatory skin condition and its prevalence is increasing globally. Researchers have convincingly correlated severity of AE with hemato-immunological abnormalities due to the complex interaction between genetic susceptibility genes and heightened immunological response.
Aim and Objective: (a) To determine association between severity of atopic eczema and total eosinophil counts. (b) To determine association between severity of atopic eczema and total serum IgE levels. (c) To determine association between total eosinophil counts and total serum IgE Levels in atopic eczema.
Materials and Methods: This was a case-control study conducted in the Department of Dermatology - OPD, Karnataka Institute of Medical Sciences, Hubballi, Karnataka. A total of 80 subjects were examined, 50 being AE cases (33 males & 17 females) and 30 age matched controls (20 males & 10 females).Study subjects underwent clinical evaluation and relevant investigations. SCORAD index, Serum IgE and Absolute Eosinophil Count (AEC) in both the groups.
Results: Increased serum IgE, AEC were more frequently observed with AE patients than in control group. There exists a positive correlation between IgE, AEC and SCORAD in AE cases than in controls. The degree of correlation between SCORAD index and serum IgE is significantly positive (r =0.66, p<0.01) in cases than in controls and this correlation is higher than that between Serum IgE and AEC.
Conclusion: The study results may conclude that the SCORAD index can be used as a cutaneous marker of hemato-immunological abnormalities. In resource poor circumstances SCORAD index can be used as a substitute for expensive blood investigation and may guide to select a proper, more effective therapeutic modality.
Introduction
Atopic dermatitis/atopic eczema (AD/AE) is a pruritic, chronically relapsing inflammatory skin condition.[1] Usually manifests for the first time in infancy or childhood and improves gradually as the age increases but sometimes it may appear for the first time in adulthood or rarely in elderly.[2] Increasing prevalence of atopic eczema presents a major public health problem worldwide posing a significant burden on healthcare resources and patient’s quality of life. The current prevalence of AE is approximately 10-30% in children and 2-10% in adults, which clearly shows anincreasing trend over the past several decades due to urbanization and increased quality of life.[3] Atopic eczema results from complex interaction between genetic susceptibility genes manifesting with defective skin barrier, defects in the innate immune system and heightened immunological response to allergens and microbial agents, accompanied by cutaneous functional dysfunction.[4], [5]
Out of the many hemato-immunological abnormalities observed in AE elevated serum Immunoglobulin E levels (IgE), total eosinophil counts are some of them which also are part of criterias in Millennium Diagnostic Criteria (MDC). Though not consistently, researchers have convincingly correlated severity of AE with hemato-immunological abnormalities. Increased production of serum IgE is the main immunoglobulin abnormality resulting in the presence of many antigen specific IgE to different antigens and frequently an increase in total serum IgE.[1] The total serum IgE level is elevated in over 80% of the patients with atopic eczema and there is a positive correlation with the extent and severity of the disease which is being used as a component in different diagnostic criterias.[2], [6] The scoring index for the clinical severity of atopic eczema, the SCORAD index interprets the extent of the disorder which consists of six items (erythema, edema/papules, effect of scratching, oozing/crust formation, lichenification and dryness ) and two subjective symptoms (itch and sleeplessness).[6] The maximum score is 103 points. The present study was undertaken to analyze the correlation among these three parameters and also to correlate the level of Absolute Eosinophil Count (AEC) and Serum IgE with the clinical severity of atopic eczema (SCORAD Index) as there are no gold standard definite diagnostic criteria or laboratory marker for the assurance of a diagnosis of AE.
Materials and Methods
This case-control study was conducted in the Department of Dermatology -OPD, Karnataka Institute of Medical Sciences, Hubballi, Karnataka. A total of 80 subjects were examined, 50 being AE cases (33 males and 17 females) and 30 age matched controls (20 males and 10 females).
Patients of atopic eczema with any associated congenital and acquired cutaneous skin disorder, immunocompromised state, and drug rashes were excluded from the study.
Defined proforma was prepared highlighting the MDC and posing as a questionnaire to the subjects. Personal and family history with special reference to atopy was inquired in up to two generations. Detailed muco-cutaneous and systemic examination was done in all subjects and SCORAD index was filled accordingly before starting any topical or systemic therapy for the present episode.
After obtaining Institutional ethical committee clearance and informed consent from the cases and controls, blood samples were collected. Absolute Eosinophil Count (AEC) was obtained from automated hematology analyzer Sysmex KX-21. Values below 450cells/ mm3 were considered normal. Total Serum IgE levels were estimated using THERMO FISHER SCIENTIFIC INVITROGEN IgE Human ELISA kit. Besides these other relevant investigations needed for the initiation and follow up of treatment as per requirement were carried out and results were recorded.
Statistical analysis
Data collected was entered on MS Excel and data was analyzed using EPI-INFO-06 statistical software. Descriptive statistics were analyzed as proportions for frequencies, mean and standard deviation for continuous measures. Chi-square test was used to find the association between the categorical variables and groups. Mean AEC, Serum IgE, Differential Eosinophil Count (DEC) was compared between cases and controls using independent sample t test. Correlation of variables such as age, AEC, DEC, Serum IgE with SCORAD index was carried out using Pearson’s correlation coefficient (r). A p value <0.05 was considered as statistically significant. Linear Regression analysis was carried out to derive a predictive equation considering SCORAD as the dependent variable and IgE, DEC and AEC as the independent variable.
Results
A total of 80 subjects were examined, 50 were AE cases and 30 age matched controls. The present study was undertaken to analyze the correlation among these three parameters - Absolute Eosinophil Count (AEC) and Serum IgE and SCORAD Index has been shown in following tables.
|
Characteristics |
Cases (n = 50) (Mean ± SD) |
Controls (n = 30) (Mean ± SD) |
p-value |
|
Males (n, %) |
33 (66.4%) |
20 (66.7%) |
0.951 |
|
Females (n, %) |
17 (33.7%) |
10 (33.3%) |
|
|
Age in Years |
8.96±7.0 |
8.93±7.1 |
0.99 |
|
Duration –Days |
17.7±9.8 |
NA |
NA |
|
Number of attacks |
1.82±0.4 |
NA |
NA |
|
SCORAD |
46.74±9.8 |
NA |
NA |
|
AEC cells/ml |
753.6±597.0 |
442.1±628.6 |
< 0.001* |
|
Serum IgE IU/ml |
186.78±170.5 |
24.73±19.3 |
< 0.001* |
|
DEC cells/ml |
9.28±7.6 |
9.73±5.6 |
0.779 |
In the present study, the proportion of males (66.4% Vs 66.7%) and females (33% Vs 33.3%) were almost similar in both cases and controls. The mean age was similar in both groups. The duration of attack was 17.7 days in cases group with the number of attacks 1.82. Serum IgE level varied from 20 IU/ml to 937 IU/ml in cases and 10 IU/ml to 70 IU/ml in controls. Mean scores of IgE was significantly higher in cases with clinical features of atopic dermatitis (186.7) than that of the controls (24.7) with a p-value<0.001. The AEC level varied from 341 cells/ml to 2567 cells/ml in cases and 150 cells/ml to 490 cells/ml in controls. The mean AEC value is significantly higher in cases (753.6) than that of controls (442.1) with a p-value< 0.001. The mean value of DEC in cases (9.28) and controls (9.73) and were almost similar. As there was no clinical evidence and relevant muco-cutaneous involvement SCORAD index was zero in controls irrespective of their serum IgE and AEC levels as shown in [Table 1].
|
Cases |
Onset age(yrs) |
Attack Duration (days) |
No of attack |
DEC cells/ml |
AEC cells/ml |
IgE (IU/ml) |
SCORAD |
|
|
Age(yrs) |
r |
0.75 |
0.10 |
0.36 |
-0.10 |
0.10 |
-0.01 |
-0.13 |
|
p |
<0.001* |
0.51 |
0.01* |
0.48 |
0.47 |
0.94 |
0.35 |
|
|
Onset age(yrs) |
r |
|
0.05 |
0.32 |
-0.22 |
-0.02 |
0.01 |
-0.14 |
|
p |
|
0.71 |
0.02* |
0.13 |
0.91 |
0.96 |
0.32 |
|
|
Attack Duration (days) |
r |
|
|
0.12 |
-0.02 |
-0.12 |
-0.07 |
-0.07 |
|
p |
|
|
0.40 |
0.91 |
0.39 |
0.64 |
0.65 |
|
|
No of attacks |
r |
|
|
|
0.00 |
0.05 |
0.08 |
0.11 |
|
p |
|
|
|
0.98 |
0.76 |
0.59 |
0.44 |
|
|
DEC (cells/ml) |
r |
|
|
|
|
0.62 |
-0.04 |
0.05 |
|
p |
|
|
|
|
<0.001* |
0.79 |
0.74 |
|
|
AEC (cells/ml) |
r |
|
|
|
|
|
-0.03 |
0.03 |
|
p |
|
|
|
|
|
0.82 |
0.82 |
|
|
IgE(IU/ml) |
r |
|
|
|
|
|
|
0.66 |
|
p |
|
|
|
|
|
|
<0.001* |
|
Controls |
|
DEC cells/ml |
AEC cells/ml |
IgE (IU/ml) |
|
Age (years) |
r |
-0.15089 |
-0.21139 |
-0.10951 |
|
p |
0.426087 |
0.262124 |
0.564568 |
|
|
DEC (cells/ml) |
r |
|
0.289949 |
-0.15759 |
|
p |
|
0.120128 |
0.405588 |
|
|
AEC (cells/ml) |
r |
|
|
0.012504 |
|
p |
|
|
0.947711 |
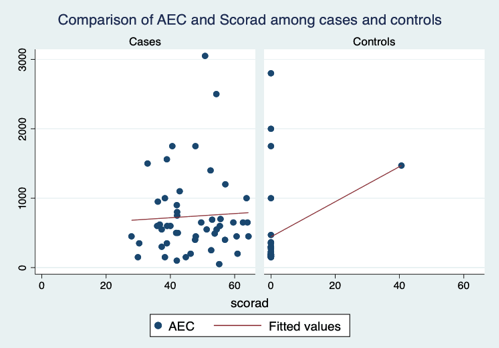
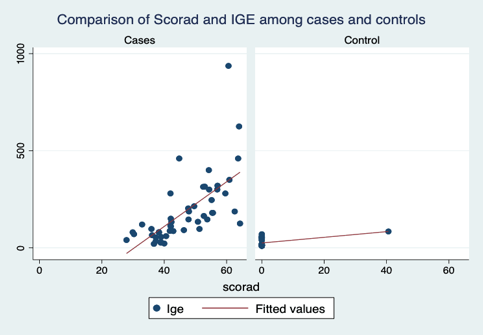
In the present study, there is a positive correlation between IgE levels, SCORAD and AEC levels. There is a significant positive correlation between SCORAD and IgE levels, SCORAD and AEC levels, IgE levels and AEC levels among cases. There is a significant positive correlation between age and number of attacks (r=0.36, p<0.01), onset age and number of attacks(r=0.32, p<0.01). In cases as IgE values increases there is an increase in SCORAD. There is a significant positive correlation between IgE and SCORAD (r =0.66, p<0.01). The degree of correlation between SCORAD index and serum IgE is significantly positive in cases than controls and this correlation is higher than that between Serum IgE and AEC in cases as shown in [Table 2], [Figure 1], [Figure 2]. However, in controls, nothing found to be significant as shown in [Table 3].
|
Age (years) |
Correlation |
DEC (cells/ml) |
AEC (cells/ml) |
IgE |
|
|
(IU/ml) |
|||
|
<2 |
r |
-0.16 |
0.101 |
|
|
|
p-value |
0.539 |
0.69 |
0.005 |
|
2 to 12 |
r |
0.224 |
0.108 |
0.636* |
|
|
p-value |
0.372 |
0.671 |
0.005 |
|
>12 |
r |
0.139 |
-0.1 |
0.789* |
|
|
p-value |
0.635 |
0.733 |
0.001 |
|
Gender |
Correlation |
DEC (cells/ml). |
AEC (cells/ml). |
IgE |
|
(IU/ml). |
||||
|
Female |
r |
-0.148 |
-0.111 |
0.797* |
|
|
p-value |
0.572 |
0.672 |
0 |
|
Male |
r |
0.127 |
0.021 |
0.605* |
|
|
p-value |
0.488 |
0.907 |
0 |
|
Duration (days) |
Correlation |
DEC (cells/ml). |
AEC (cells/ml). |
IgE (IU/ml). |
|
<10 |
r |
0.008 |
0.046 |
0.702* |
|
|
p-value |
0.979 |
0.876 |
0.005 |
|
>10 |
r |
0.06 |
0.032 |
0.682* |
|
|
p-value |
0.731 |
0.852 |
0 |
[Table 4] shows correlation among IgE, AEC, DEC with SCORAD in cases with regard to infantile, childhood, and adult age group. In all the above three age groups there was a significant positive correlation between IgE and SCORAD. However, the correlation is observed more so in the age group of >12 years (r =0.633, p<0.05). Similar gender wise and duration wise correlation is also significant.
|
Regression Model Summary |
||||
|
R |
R Square |
Adjusted R Square |
Std. Error of the Estimate |
Durbin-Watson |
|
0.676a |
0.458 |
0.436 |
17.92602 |
0.68 |
|
Predictors: (Constant), IgE (IU), DEC, AEC |
||||
|
Dependent Variable: SCORAD |
||||
|
Model |
Unstandardized Coefficients |
t |
Sig. |
|
|
B |
Std. Error |
|||
|
(Constant) |
14.559 |
3.907 |
3.727 |
0 |
|
DEC |
-0.313 |
0.338 |
-0.927 |
0.357 |
|
AEC |
0.008 |
0.004 |
2.236 |
0.028 |
|
IgE (IU) |
0.098 |
0.013 |
7.264 |
0 |
[Table 5] Predictive equation was generated for SCORAD as mentioned below.
SCORAD = 14.559 + (0.08) x AEC – (0.313) x DEC +(0.098) x IgE (IU).
Linear regression analyses were used to predict one variable based on the other variable. The above predictive equation was derived after linear regression analysis. It can be interpreted as -With one unit change in SCORAD Score the IgE (IU) would increase by 0.098 (IU), DEC will reduce by -0.313 unit and AEC will increase by 0.08. The ANOVA test showed significant finding (F = 21.08, p<0.05) which means that AEC, DEC and IgE can be used to reliably predict the SCORAD Scores. The r square shows how well the regression model fits the observed data. Here the r-square value was 45% which was not a good fit. However, more variables with a large sample size would yield a better prediction of results.
Discussion
Serum immunoglobulin E, eosinophils and other immune cells are involved in the pathogenesis of atopic eczema. IgE is a key molecule that can activate effector cells involved in allergic inflammation.[5] In our study, majority of atopic eczema cases were males (66.4%). Another study also found that atopic eczema has more male preponderance. [7], [8] The prevalence of atopic eczema has been increasing over the past four decades in developed countries and also in India.[9], [10], [11], [12] Our study was a hospital based rather than population-based, so the exact incidence of atopic eczema in the community could not be estimated. The results of the above study shows that there exists a significant presence of AEC and Serum IgE levels in patients with AE to assess their possible relationship to the severity of the disease (SCORAD Index). Serum IgE levels in atopic eczema patients were significantly higher than in healthy controls and significantly correlated with SCORAD index and Serum AEC levels. Both Serum IgE levels and AEC levels correlate with clinical severity scores. These results suggest that the values of serum IgE and AEC can be used as a parameter of assessment of severity of activity of atopic eczema and may support a plausible role of eosinophils and eosinophils mediated cytokines in the pathogenesis of atopic eczema.[13], [14], [15]
Conclusion
The present results may conclude that the clinical activity of atopic eczema as recorded by the SCORAD index can be used as a surrogate indicator of the underlying systemic hemato-immunological abnormalities. By avoiding expensive laboratory blood investigations especially in resource poor settings of the community, relying on SCORAD index may help to choose appropriate therapeutic modality in a particular patient and also helps to predict the prognosis.
Source of Funding
No financial support was received for the work within this manuscript.
Conflict of Interest
The authors declare they have no conflict of interest.
Acknowledgement
I would like to thank Radhika K, Assistant professor (Statistician), Dept. of Preventive and Social Medicine (ESIC MC, PGIMSR, Rajajinagar, Bangalore) for the statistical guidance.
References
- Jones M, Flohr C, Reynolds N, Holden C, Griffiths C, Barker J, et al. Atopic Eczema. Rook’s Textbook of Dermatology. 2016. [Google Scholar]
- Hu Y, Liu S, Liu P, Mu Z. Jianzhong Zhang;Clinical relevance of eosinophils, basophils, serum total IgE level, allergen-specificIgE, and clinical features in atopic dermatitis. J Clin Lab Anal. 2020;34(6). [Google Scholar] [Crossref]
- Swamy A, KS, Nanjundaswamy B, Bangaru H. Epidemiological profile and clinical pattern of atopic dermatitis in South Indian teaching hospital. Indian J Clin Exp Dermatol. 2019;5(2):146-53. [Google Scholar]
- Bieber T, Bussmann C, Dermatitis A, JB, JJ, Schaffer J, et al. Atopic Dermatitis. Dermatology. 2012. [Google Scholar]
- Carballo I, Alonso-Sampedro M, Gonzalez-Conde E, Sanchez-Castro J, Vidal C, Gude F. Factors Influencing Total Serum IgE in Adults: The Role of Obesity and Related Metabolic Disorders. Int Arch Allergy Immunol. 2021;182(3):220-8. [Google Scholar]
- Barbee R, Halonen M, Lebowitz M, Burrows B. Distribution of IgE in a community population sample: correlations with age, sex, and allergen skin test reactivity. J Allergy Clin Immunol. 1981;68(2):106-11. [Google Scholar]
- DL, LE, Boguniewicz M, Wolff K, Fitzpatrick T, Goldsmith L, et al. Atopic dermatitis. Fitzpatrick's dermatology in general medicine. 2008. [Google Scholar]
- AG, RAlende, Gude F, Campos J, Rey J, Meijide L. Serum levels of immunoglobulins (IgG, IgA, IgM) in a general adult population and their relationship with alcohol consumption, smoking and common metabolic abnormalities. Clin Exp Immunol. 2008;151(1):42-50. [Google Scholar]
- Stalder J, Taieb. European Task Force on Atopic Dermatitis. Severity Scoring of Atopic Dermatitis: SCORAD INDEX; Clinical and Laboratory Investigations. Clin Lab Investig Dermatol. 1993;186:23-31. [Google Scholar]
- Mani Kant Kumar PK, Singh PK, Patel. Clinico-immunological profile and their correlation with severity of atopic dermatitis in eastern Indian children. Journal of Natural Science. 2014;5:95-100. [Google Scholar]
- Dhar S. Atopic dermatitis: Indian scenario. Indian J Dermatol VenereolLeprol. 1999;65(6):253-7. [Google Scholar]
- Sarkar R, Kanwar A. Clinico-epidemiological profile and factors affecting severity of atopic dermatitis in north Indian children. Indian J Dermatol. 2004;49:117-22. [Google Scholar]
- Williams H. Is the prevalence of atopic dermatitis increasing?. Clin Exp Dermatol. 1992;17(6):385-91. [Google Scholar]
- Agha F. Serum IgE levels in patients with allergic problems and healthy subjects. J Pak Med Assoc. 1997;47(6):166-9. [Google Scholar]
- Ansotegui I, Melioli G, Canonica G, Caraballo L, Villa E, Ebisawa M. IgE allergy diagnostics and other relevant tests in allergy, a World Allergy Organization position paper. World Allergy Organ J. 2020;13(2). [Google Scholar] [Crossref]
Article Metrics
- Visibility 8 Views
- Downloads 2 Views
- DOI 10.18231/pjms.v.15.i.1.30-35
-
CrossMark

- Citation
- Received Date April 16, 2023
- Accepted Date June 13, 2024
- Publication Date March 12, 2025