Panacea Journal of Medical Sciences
Panacea Journal of Medical Sciences (PJMS) open access, peer-reviewed triannually journal publishing since 2011 and is published under auspices of the “NKP Salve Institute of Medical Sciences and Research Centre”. With the aim of faster and better dissemination of knowledge, we will be publishing the article ‘Ahead of Print’ immediately on acceptance. In addition, the journal would allow free access (Open Access) to its contents, which is likely to attract more readers and citations to articles published in PJMS.Manuscripts must be prepared in accordance with “Uniform requiremen...
Dysmorphic RBCs in chronic kidney disease: Can it determine the extent of glomerular damage?- An institutional experience
Abstract
Introduction: Chronic kidney disease (CKD) is a global health concern, associated with rising risk factors. Glomerular filtration rate (GFR) measures renal function, crucial for prognosis. Dysmorphic red blood cells (RBCs) in urine, indicating glomerular issues, might correlate with serum creatinine and estimated GFR. This study explores their potential as accessible markers for renal function assessment.
Materials and Methods: The year-long study at KR Hospital, Mysore, involved 40 diagnosed CKD patients. Urine analysis, collected in a sterile environment, underwent phase-contrast microscopy. Hematuria and dysmorphic RBCs (<25>25%) were assessed. Serum creatinine levels were measured, and eGFR calculated using a formula. Inclusion criteria covered diagnosed CKD cases aged >20, excluding those <20. Descriptive statistics, including frequencies, percentages, mean, and standard deviation, were calculated for the variables.
Results: The study examined 40 CKD patients aged 22 to 92 (mean age: 51.8). The majority of cases were observed in the 10-20, 30-40, and 50-60 age groups. Males accounted for 52.5%, with a higher average age compared to females. Dysmorphic RBCs were present in 80% of cases.
Conclusion: There was no significant correlation between the presence or percentage of dysmorphic RBCs and serum creatinine or eGFR levels. The distribution of dysmorphic RBCs across different eGFR levels showed no significant association.
Introduction
Chronic kidney disease (CKD) comprises continuous renal impairment characterised by decreasing glomerular filtration rate (GFR).[1]
GFR is defined as the rate at which plasma is filtered in the glomerular capillaries, and it is measured in mL per minute and normalized to 1.73 m².[1], [2], [3] Chronic kidney disease (CKD) has emerged as one of the leading causes of death and suffering in the 21st century, primarily attributable to the rise in risk factors, such as obesity and diabetes mellitus, the number of patients affected by CKD has also been increasing continuously, affecting an estimated 843.6 million individuals worldwide in 2017. [4], [5] To differentiate CKD from Acute Kidney Injury decrease in the GFR should be noted for at least 90 days. [5], [6] Lower levels of GFR indicates poorer filtration of urine by the glomeruli indicating poorer prognosis.
Since the publication of their seminal paper by Fairley and Birch[7], [8] on glomerular and nonglomerular hematuria, it has been that two main types of red blood cells (RBCs) are identified in the urine i.e. isomorphic (indicative of nonglomerular bleeding) and dysmorphic RBC (being a marker of glomerular diseases).
RBC dysmorphism is thought to be as a result of distortion of RBC membranes passing through glomerular gaps. [9] Glomerular causes of CKD are the leading cause of CKD which includes Diabetes mellitus and Hypertension.
The measurement of GFR plays a crucial role in determining a patient's prognosis and assessing the risk of progressing to End Stage Renal Disease (Stage V CKD). [1] In a healthy young adult, the normal GFR range is approximately 100 to 125 mL/min per 1.73 m² of body surface area (BSA). [10]
Glomerular filtration measurement can be achieved through exogenous (inulin clearance) and endogenous (Creatinine or cystatin clearance) methods, both considered gold standards for Chronic Kidney Disease (CKD) progression. However, these methods are often impractical for the general population due to required expertise and equipment costs.
To address this limitation, an eGFR (estimated Glomerular Filtration Rate) formula was developed, utilizing serum creatinine or serum Cystatin C. The formula underwent multiple modifications, leading to the CKD-EPI equation (Chronic Kidney Disease Epidemiology Collaboration). This equation, now widely adopted globally, has largely replaced inulin and creatinine clearance measurements in clinical settings due to its efficiency and cost-effectiveness.
While eGFR may not match the consistency of measured Glomerular Filtration Rate, its rapid accessibility has significantly increased its utility, making it a valuable tool in clinical practice. [11]
Urinary erythrocyte morphology examined by phase‐contrast microscopy is a ‘classical’ and important diagnostic tool, because it helps distinguish the causes of hematuria. [12], [13]
Urinary erythrocyte microscopy can be used to determine the extent of glomerular membrane damage and be a marker as an adjuvant for eGFR. However there is a dearth of studies and articles regarding the same.
The purpose of this study is to determine whether presence of dysmorphic RBCs in urine and the quantity of dysmorphic RBCs in urine correlates with serum creatinine and estimated glomerular filtration rate and whether it can be a suitable substitute determine glomerular filtration rate and it is an easily accessible test with minimal expertise and setup requirements.
Materials and Methods
The study, conducted from January to December 2021 over twelve months at the Department of Pathology, KR Hospital, Mysore, assessed 40 previously diagnosed patients. Urine, collected in a sterile environment, underwent urinalysis within 2 hours. Following centrifugation (377.33 g, 10 min), 9.5 mL of the supernatant was discarded, and the sediment was examined using phase contrast microscopy (Olympus CX-43). The presence of hematuria was initially determined, with dysmorphic RBCs categorized as <25% or >25% if hematuria was present.[14] Serum creatinine levels were assessed in the biochemistry department, and eGFR was calculated using the formula:
GFR = 141 x [min(Scr/κ,1)^α] x [max(Scr/κ, 1)^-1.209] x [0.993^Age] x {1.018 [if female]} x {1.159 [if black]}.
Scr represents serum creatinine (mg/dL), κ is 0.7 for females and 0.9 for males, α is -0.329 for females and -0.411 for males. Min indicates the minimum of Scr/κ or 1, and max indicates the maximum of Scr/κ or 1. [15]
Inclusion criteria
Diagnosed cases of CKD admitted in KR Hospital, Mysore, between January to December 2021 aging more than 20 years of age.
Exclusion criteria
Patients aged less than 20 years of age.
Data was entered into Microsoft Excel and it was double checked. Data analysis was done using SPSS (Statistical Package for Social Sciences) version 22.0. Descriptive statistics like frequencies and percentages for categorical variables and mean and standard deviation were calculated for continuous variables. Chi-square test and Fisher test (if appropriate) were used to find the association between presence of dysmorphic RBCs and other parameters in the study, p value < 0.05 was considered to be significant.
Results
In the current study a total of 40 patients diagnosed with CKD were assessed with ages ranging from 22 years to 92 years. The mean age was 51.8 years, the median age being 50 years, the mode age of 40 years. The maximum cases were observed in the 30-40 and 50-60 age groups accounting for 7 cases i.e. 17.5% cases of total cases each. There was slight preponderance to males accounting for 52.5%cases compared to females being 47.5%, the average female age being 48.68 and the average male age being 54.62.([Table 1])
|
Age range (yrs) |
Males |
Females |
Total |
|
20-30 |
3 |
2 |
5 |
|
30-40 |
3 |
4 |
7 |
|
40-50 |
1 |
5 |
6 |
|
50-60 |
4 |
3 |
7 |
|
60-70 |
5 |
1 |
6 |
|
70-80 |
3 |
3 |
6 |
|
80-90 |
1 |
1 |
2 |
|
90-100 |
1 |
0 |
0 |
|
Total |
21 |
19 |
40 |
In the given study the minimum serum creatinine level seen was 1.88 milligrams per decilitre, whereas the maximum creatinine levels were seen at 5.15 milligrams per decilitre. In a similar vein the maximum number of cases seen for the eGFR calculations were seen in the 30-44 ml/min group accounting for 50% or 20 cases [[Table 3], [Table 5]].
In the above study Dysmorphic RBCs were seen in 80% of the cases (32 cases out of 40) [[Table 2], [Table 4]].
Of the 32 cases which showed presence of Dysmorphic RBCs in urine 21 cases [ 52.5% of the total population and 65.66% of the cases showing dysmorphic RBCs] showed > 25 % of all the RBCs in the urine showing Dysmorphism [[Table 3], [Table 5]].
|
Dysmorphic RBCs |
Serum creatinine levels (in mg/dl) |
p Value |
|||
|
<2 |
2-4 |
>4 |
Total |
|
|
|
Present |
6 |
18 |
8 |
32 |
Chi square test: 0.47 |
|
Absent |
3 |
4 |
1 |
8 |
Fisher's exact test: 0.57 |
|
Total |
9 |
22 |
9 |
40 |
|
|
Dysmorphic RBCs percentage |
Serum creatinine levels (in mg/dl) |
p Value |
|||
|
<2 |
2-4 |
>4 |
Total |
|
|
|
<25% |
4 |
5 |
2 |
11 |
Chi square test: 0.17 |
|
>25% |
2 |
13 |
6 |
21 |
Fisher's exact test: 0.23 |
|
Total |
6 |
18 |
8 |
32 |
|
|
Dysmorphic RBCs |
eGFR levels (in ml/min) |
p Value |
||||
|
<15 |
15-29 |
30-44 |
45-59 |
Total |
|
|
|
Present |
6 |
8 |
17 |
1 |
32 |
Chi square test: 0.58 |
|
Absent |
1 |
3 |
3 |
1 |
8 |
Fisher's exact test: 0.49 |
|
Total |
7 |
11 |
20 |
2 |
40 |
|
|
Dysmorphic RBCs percentage |
eGFR levels (in ml/min) |
p Value |
||||
|
<15 |
15-29 |
30-44 |
45-59 |
Total |
|
|
|
<25% of all RBCs |
2 |
2 |
6 |
1 |
11 |
Chi square test: 0.52 |
|
>25% of all RBCs |
4 |
6 |
11 |
0 |
21 |
Fisher's exact test: 0.64 |
|
Total |
6 |
8 |
17 |
1 |
32 |
|
|
Dysmorphic RBCs percentage |
eGFR levels (in ml/min) |
p Value |
|||
|
<15 |
15-29 |
30-44 |
Total |
|
|
|
>25 & <50% of total RBCs |
0 |
1 |
7 |
8 |
Chi square test: 0.03 |
|
>50% of total RBCs |
4 |
5 |
4 |
13 |
Fisher's exact test: 0.055 |
|
Total |
4 |
6 |
11 |
21 |
|
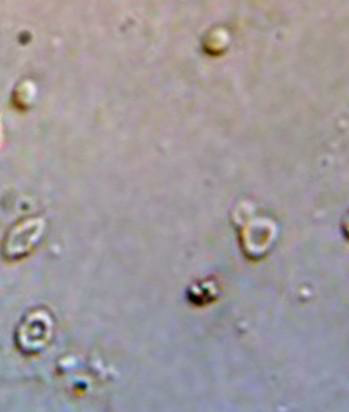
[Figure 1] When comparing presence or absence of dysmorphic RBCs to the serum creatinine levels it was observed that even though more number of cases i.e. ¼/ 25% of the cases showing presence of dysmorphic RBCs had a serum creatinine level of >4 mg/dl compared to the 12.5% cases having no dysmorphic RBCs having a serum creatinine level of more than 4 mg/dl, there was no statistical correlation seen in the above cases.([Table 2])
When comparing the percentage of dysmorphic RBCs to the serum creatinine levels it was observed that even though lesser number of cases i.e.2/11 i.e.18.18% of the cases showing dysmorphic RBCs having <25% of the total RBCs had a serum creatinine level of >4 mg/dl compared to the 28.57% cases having >25% dysmorphic RBCs having a serum creatinine level of more than 4 mg/dl, there was no statistical correlation seen in the above cases.([Table 3])
When comparing the presence of Dysmorphic RBCs versus eGFR levels it was observed that the distribution of dysmorphic red blood cells (RBCs) across different estimated glomerular filtration rate (eGFR) levels was examined. Chi-square and Fisher's exact tests yielded non-significant p-values of 0.58 and 0.49, respectively, indicating no significant association between dysmorphic RBCs and eGFR levels. Notably, the percentage of dysmorphic RBCs was highest (40%) in the 15-29 ml/min eGFR range, while the absence of dysmorphic RBCs was most prevalent (75%) in the 45-59 ml/min eGFR range.([Table 4])
When comparing the percentage of dysmorphic RBCs to the eGFR levels, the presented data reveals the distribution of dysmorphic red blood cells (RBCs) percentages across varying estimated glomerular filtration rate (eGFR) levels. Statistical tests indicate non-significant associations, with a Chi-square p-value of 0.52 and Fisher's exact test yielding 0.64. Notably, eGFR levels below 15 ml/min exhibit the highest percentage of dysmorphic RBCs constituting >25% of all RBCs (66.7%), while the 45-59 ml/min eGFR range shows an absence of dysmorphic RBCs constituting >25% of all RBCs.([Table 5])
When comparing increased dysmorphic RBCs percentage versus eGFR levels, the distribution of dysmorphic red blood cells (RBCs) percentage across estimated glomerular filtration rate (eGFR) levels, the data reveal distinct patterns. The eGFR levels are stratified into three categories: <15, 15-29, and 30-44 ml/min. Within each eGFR category, dysmorphic RBCs are further categorized based on their proportion to total RBCs, including >25% & <50% of total RBCs and >50% of total RBCs.
Examining the percentage within each subgroup, it is evident that the <15 ml/min eGFR category exhibits a higher percentage of dysmorphic RBCs, particularly exceeding 50% of total RBCs. Conversely, as eGFR levels increase, there is a noticeable decrease in the percentage of dysmorphic RBCs. The Chi-square test, with a p-value of 0.03, emphasizes the statistical significance of these observations, indicating a non-random association.
Supplementing these findings, Fisher's exact test, with a p-value of 0.055, suggests a potential association between dysmorphic RBCs and eGFR levels, albeit not meeting conventional significance threshold.([Table 6])
Discussion
Chronic kidney disease is identified by the persistence of an abnormality in kidney structure or function for a duration exceeding three months. [16]
This involves meeting any of the following criteria:[1] GFR below 60 mL/min/1.73 m²;[2] presence of albuminuria, defined as urine albumin levels ≥30 mg per 24 hours or a urine albumin-to-creatinine ratio [ACR] ≥30 mg/g;[3] identification of abnormalities in urine sediment, histology, or imaging indicating kidney damage; [4] diagnosis of renal tubular disorders; or [5]a past history of kidney transplantation [16].
The mean age in the above study was 51.8 which is comparable to the study done by Hamadah et al[14] which had a mean age 56.7 but showed a considerable difference to the study done by Agarwal SK et al[17] which had a mean age of 59.
Males constituted a majority of the patients at 51% whereas females constituted 49% cases which contrasted to the study done by Hamadah et al[14] which had a majority of women cases, but was comparable to the study done by Agarwal SK et al[17] which had a slight male preponderance.
Examining the correlation between Dysmorphic Red Blood Cells (RBCs) and serum creatinine levels in a sample of 40 patients reveals a non-significant association, as indicated by the Chi-square Test (p=0.47) and supported by the Fisher's Exact Test (p=0.57). Dysmorphic RBCs are prevalent, observed in 80% of cases, while absent in the remaining 20%. Regarding serum creatinine levels, the majority (45%) falls below 2 mg/dl, and 55% of cases with Dysmorphic RBCs show levels between 2-4 mg/dl. Notably, a smaller subset (7.5%) with Dysmorphic RBCs exhibits serum creatinine levels exceeding 4 mg/dl. These findings suggest a potential connection between Dysmorphic RBCs and elevated serum creatinine levels, but caution is essential due to the non-significant p values and the limited sample size. The study's findings may not be fully generalizable, emphasizing the need for larger-scale investigations to validate and expand upon these initial observations.
The data on dysmorphic red blood cells (RBCs) percentage and serum creatinine levels reveals that among the 32 individuals, 11 fall within the <25% range, while 21 fall within the >25% range. Specifically, within the >25% range, 13 individuals exhibit serum creatinine levels in the 2-4 range. The chi-square test yielded a p-value of 0.17, indicating a non-significant association between dysmorphic RBCs percentage and serum creatinine levels. Fisher's exact test corroborates this with a p-value of 0.23. It's important to acknowledge the limitations of this analysis, as correlation does not imply causation, and additional factors may contribute to the observed patterns. Moreover, the sample size should be considered when drawing conclusions, and caution is advised in generalizing these findings to larger populations.
The examination of dysmorphic red blood cells (RBCs) in relation to estimated glomerular filtration rate (eGFR) levels illustrates that among the 40 individuals, 32 show the presence of dysmorphic RBCs. Notably, 17 of these individuals fall within the 30-44 eGFR range. The chi-square test yielded a p-value of 0.58, suggesting a lack of significant association between dysmorphic RBCs and eGFR levels. This finding is further supported by Fisher's exact test, which produced a p-value of 0.49. It is crucial to acknowledge the limitations inherent in this interpretation, as correlation does not imply causation, and other variables may contribute to the observed patterns. Additionally, the sample size should be considered when extrapolating these results, and caution is advised in applying these findings to broader populations.
The examination of dysmorphic red blood cells (RBCs) percentage in relation to estimated glomerular filtration rate (eGFR) levels reveals that among the 32 individuals, 21 exhibit dysmorphic RBCs constituting more than 25% of all RBCs. Specifically, within this group, 11 individuals fall within the 30-44 eGFR range. The chi-square test yielded a p-value of 0.52, suggesting a lack of significant association between dysmorphic RBCs percentage and eGFR levels. This conclusion is supported by Fisher's exact test, which produced a p-value of 0.64. However, it is important to acknowledge the limitations of this interpretation, as correlation does not imply causation, and other variables may influence the observed patterns. Furthermore, cautious consideration is warranted when applying these findings to broader populations, given the impact of sample size on generalizability.
The assessment of dysmorphic red blood cells (RBCs) percentage in relation to estimated glomerular filtration rate (eGFR) levels indicates that out of the 11 individuals, 13 exhibit dysmorphic RBCs constituting more than 50% of total RBCs. Specifically, within this group, 4 individuals fall within the <15 eGFR range. The chi-square test yielded a low p-value of 0.03, suggesting a statistically significant association between dysmorphic RBCs percentage and eGFR levels. This finding is further supported by Fisher's exact test, which produced a p-value of 0.055. However, it is crucial to recognize the limitations of this interpretation, as statistical significance does not imply causation, and other variables may contribute to the observed patterns. Additionally, the sample size should be considered when extrapolating these results, and caution is advised in applying these findings to broader populations.
The examination of dysmorphic red blood cells (RBCs) percentage in relation to estimated glomerular filtration rate (eGFR) levels for a total of 21 individuals suggests a potential association. Thirteen individuals exhibit dysmorphic RBCs constituting more than 50% of total RBCs, with 4 falling within the <15 eGFR range. The chi-square test yielded a statistically significant p-value of 0.03, indicating an observed association. However, the Fisher's exact test produced a p-value of 0.055, slightly above the conventional threshold, suggesting a trend toward association without reaching strong statistical significance. This points to a potential link between dysmorphic RBCs percentage and eGFR levels, and further exploration may refine our understanding of this relationship.
Limitations of the Study
The study's primary limitations stem from its relatively small sample size, potentially restricting the extent to which findings can be generalized to broader populations. Additionally, if the research is conducted in a single center, it may lack the diverse representation needed to capture variations across different demographics. The cross-sectional design, as another limitation, permits the identification of associations but falls short of establishing causal relationships, providing only a snapshot of data at a specific moment. These constraints emphasize the need for caution when interpreting and applying the study's results to broader medical contexts.
Conclusion
In conclusion it was observed that presence/ absence and the increase and decrease in percentage of dysmorphic RBCs in urine is not significant with the various prognostic factors of Chronic Kidney Disease and cannot be considered as a useful marker for the disease progression. However further studies with Renal biopsies would provide a better insight.
Source of Funding
None.
Conflict of Interest
None.
References
- Schwartz G, Furth S. Glomerular filtration rate measurement and estimation in chronic kidney disease. Pediatr Nephrol. 2007;22(11):1839-48. [Google Scholar]
- Warwick J, Holness J. Measurement of Glomerular Filtration Rate. Semin Nucl Med. 2022;52(4):453-66. [Google Scholar]
- Garnett E, Parsons V, Veall N. Measurement of glomerular filtration-rate in man using a 51Cr/edetic-acid complex. Lancet. 1967;1(7494):818-9. [Google Scholar]
- Jager K, Kovesdy C, Langham R, Rosenberg M, Jha V, Zoccali C. A single number for advocacy and communication-worldwide more than 850 million individuals have kidney diseases. Kidney Int. 2019;96(5):1048-50. [Google Scholar]
- Kovesdy C. Epidemiology of chronic kidney disease: an update 2022. Kidney Int. 2011;12(1):7-11. [Google Scholar]
- . Kidney Disease: Improving Global Outcomes (KDIGO) CKD Work Group KDIGO 2012 clinical practice guideline for the evaluation and management of chronic kidney disease. Kidney Int Suppl. 2013;3(1):1-150. [Google Scholar]
- Fairley K, Birch D. Hematuria: a simple method for identifying glomerular bleeding. Kidney Int. 1982;21(1):105-8. [Google Scholar]
- JP, Bosan I, Garigali G, Fogazzi G. Urinary red blood cells: not only glomerular or nonglomerular. Nephron Clin Pract. 2012;120(1):36-41. [Google Scholar]
- Rath B, Turner C, Hartley B. What makes red cells dysmorphic in glomerular haematuria?. Pediatr Nephrol. 1992;6(5):424-7. [Google Scholar]
- Inker L, Titan S. Measurement and Estimation of GFR for Use in Clinical Practice: Core Curriculum 2021. Am J Kidney Dis. 2021;78(5):736-49. [Google Scholar]
- Zsom L, Zsom M, Salim SA, Fülöp T. Estimated Glomerular Filtration Rate in Chronic Kidney Disease: A Critical Review of Estimate-Based Predictions of Individual Outcomes in Kidney Disease. Toxins (Basel). 2022;14(2). [Google Scholar] [Crossref]
- Schifferli J, Rees A, Pearse E. Haematuria: glomerular or non-glomerular?. Lancet. 1979;2(8150). [Google Scholar] [Crossref]
- Dong Z, Wang Y, Qiu Q, Hou K, Zhang L, Wu J. Dysmorphic erythrocytes are superior to hematuria for indicating non-diabetic renal disease in type 2 diabetics. J Diabetes Investig. 2016;7(1):115-20. [Google Scholar]
- Hamadah A, Gharaibeh K, Mara K, Thompson K, Lieske J, Said S. Urinalysis for the diagnosis of glomerulonephritis: role of dysmorphic red blood cells. Nephrol Dial Transplant. 2018;33(8):1397-403. [Google Scholar]
- LI, Eneanya N, Coresh J, Tighiouart H, Wang D, Sang Y. New Creatinine- and Cystatin C-Based Equations to Estimate GFR without Race. N Engl J Med. 2021;385(19):1737-49. [Google Scholar]
- Kampmann J, Heaf J, Mogensen C. Prevalence and incidence of chronic kidney disease stage 3-5 - results from KidDiCo. BMC Nephrol. 2023;24(1). [Google Scholar] [Crossref]
- Agarwal S, Dash S, Irshad M, Raju S, Singh R, Pandey R. Prevalence of chronic renal failure in adults in Delhi, India. Nephrol Dial Transplant. 2005;20(8):1638-42. [Google Scholar]
Article Metrics
- Visibility 9 Views
- Downloads 4 Views
- DOI 10.18231/pjms.v.15.i.1.42-47
-
CrossMark

- Citation
- Received Date April 23, 2024
- Accepted Date August 28, 2024
- Publication Date March 12, 2025