Panacea Journal of Medical Sciences
Panacea Journal of Medical Sciences (PJMS) open access, peer-reviewed triannually journal publishing since 2011 and is published under auspices of the “NKP Salve Institute of Medical Sciences and Research Centre”. With the aim of faster and better dissemination of knowledge, we will be publishing the article ‘Ahead of Print’ immediately on acceptance. In addition, the journal would allow free access (Open Access) to its contents, which is likely to attract more readers and citations to articles published in PJMS.Manuscripts must be prepared in accordance with “Uniform requiremen...
Comparative study of clinical profile, Insulin and C-peptide levels in lean and obese Indian type 2 diabetic patients
Abstract
Background: We proposed hypothesis that obese and lean Indian type 2 diabetes mellitus patients would have diverse insulin secretory function and clinical representation. We conducted a study to compare serum Insulin, C-peptide levels, and clinical profile in lean and obese type 2 diabetes patients.
Materials and Methods: Two hundred patients (100 underweight and 100 obese) were selected. Underweight (lean) was defined as BMI <18.5 kg/m2 and obese as BMI ≥ 25 kg/m2 according to world health organization (WHO) Asia Pacific criteria. The demographic characteristics, clinical profile, biochemical profile and complications were compared between lean and obese diabetic patients.
Results: In lean compared to obese, there was higher prevalence of males (69% vs 42%), low socioeconomic status (78% vs 41%), higher rate of alcohol abuse (12% vs 5%) and cigarette smoking (32% vs 24%), more prevalent use of insulin (36% vs 24%), lower blood pressure, higher prevalence of peripheral neuropathy (46% vs 28%), higher retinopathy prevalence (33% vs 24%), lower coronary artery disease prevalence (9% vs 12%), lower TG level (190.86 ± 37.44 vs 241.7 ± 84.63, p-value < 0.0001), lower insulin level (6.404 ± 2.24 vs 23.82 ±2.04, p-value < 0.0001), lower C-peptide level (2.14 ±0.35 vs 2.48 ± 0.29, p-value < 0.0001) and higher HbA1c (9.818 ±1.95 vs 9.053 ±1.99, p-value 0.0066).
Conclusion: In lean diabetic patient, non-traditional factors, acquired factors, and genetic predisposition may cause development of smaller beta cell mass and hence predominant insulin deficiency. We must have overcome the insulin resistance and cardiovascular risk factors in obese counterparts
Introduction
According to the International Diabetes Federation, the population of diabetic patients were approximately 415 million in the world in 2015 and by 2040, predicted number of diabetics will be 642 million.[1] India stands second in the world, with 69.2 million people of diabetes. On the report of particular geographic region, the term lean or underweight have been explained in a few ways in different studies. According to World health organization (WHO) Asia Pacific criteria, underweight has been defined as body mass index (BMI) <18.5 kg/m2 and obese as BMI ≥ 25 kg/m2. [2] The United States studies have defined the BMI of 18-24.9 kg/m2, for lean patients. [3] The low body weight (lean) type 2 diabetes mellitus patient’s prevalence, have been reported from 1.6% to 26% in India. [4], [5], [6] The Insulin and connecting peptide (C-peptide) are produced in equimolar concentrations and elevated levels of insulin corresponds with high levels of C-peptide. [7] In contrast to insulin and proinsulin, C-peptide does not appear to be metabolically active, because of its negligible hepatic extraction, and constant peripheral clearance at different plasma glucose concentrations. [8], [9] The pathophysiology of lean diabetes and its differentiation from classical type 2 diabetes is the matter of debate. The mechanism of insulin secretion strikes as being basic defect in lean diabetes patients whereas peripheral insulin resistance is culprit in classical type 2 diabetes. On the report of Asia-pacific region, few data have been shown regarding insulin secretory status and its association with body weight. [10] Indian type 2 diabetic patients are usually less obese as compare to European type 2 diabetic patients. We proposed the hypothesis that Indian obese and lean type 2 diabetic patients would have dissimilar clinical and insulin secretory description. On the basis of above background, we studied the clinical profile, Insulin and C-peptide levels in lean and obese type 2 diabetic patients.
Materials and Methods
We conducted a cross-sectional study in the department of Medicine at tertiary care and teaching hospital of Northern India. The ethical committee of institution approved the study protocol. Patients were screened over 12-months between February 2020 to January 2021.
Inclusion criteria
All the patients who gave written consent for enrolment into study, Nine hundred twenty-one consecutive type 2diabetes patients were screened, defined according to American Diabetes Association (ADA) criteria, and 200 patients (100 underweight and 100 obese) were selected.
Exclusion criteria
Patients with BMI between 18.5 to 24.9 kg/m2, type 1 diabetes, altered sensorium, diabetic ketoacidosis, acute coronary syndrome, kidney failure, acute and chronic liver disease, septicaemia, mycobacterium tuberculosis, and malignancy patients were excluded.
Procedure
All patients were interrogated for any intercurrent illness and clinical information was taken in detail. All the anthropometric measurements were recorded in the form of height, weight, BMI and waist circumference and clinical examination was done thoroughly to rule out diabetic complications. Body weight was measured while patients were barefoot and wearing only light clothing. Body height was measured without shoes. Underweight (lean) was defined as BMI <18.5 kg/m2 and obese as BMI ≥ 25 kg/m2. The central obesity was defined as waist circumference (WC) ≥ 90 cm in male and ≥ 80 cm in female. [11] Blood pressure was measured in supine position with a mercury sphygmomanometer after patients had rested for at least 15 minutes. Diastolic blood pressure was taken at Korotkoff sound V. The mean of two readings measured one minute apart was used. The higher reading of blood pressure in either arm was taken in to consideration as the final.
Venous blood sample was taken after at least 8 hours of fasting and measurement of complete blood count, fasting plasma glucose (FPG), C-peptide, insulin, lipid profile, and glycated haemoglobin (HbA1c) were done. Urine routine and microscopy was done for all the study patients. Lipid profile was measured by spectrophotometry. Fasting plasma glucose was measured by hexokinase method. HbA1c level was estimated by high performance liquid chromatography. Fasting insulin concentrations were measured by chemiluminescent microparticle immunoassay. Fasting plasma C-peptide was measured by chemiluminescent immunoassay. All patients underwent electrocardiography and electrocardiogram (ECG) was done to diagnose ischemic heart disease. Diabetic neuropathy was diagnosed on the basis of subjective symptoms, glove stocking type of anaesthesia, abnormal monofilament testing, and absence of ankle jerk. The help of expert ophthalmologist was taken to do fundus examination and to diagnose diabetic retinopathy. The patients were diagnosed to be having diabetic nephropathy, if they had persistent proteinuria for last three consecutive months in their medical records.
Statistical analysis
Statistical package for social sciences (SPSS) software (version 18.0 for Windows) was used to analyze the data. Values are presented as mean ± standard deviation. Frequency (%) is presented where categorical variables could not follow the normal distribution. The means of different variables were compared by applying t-test between two groups. The categorical variables were analysed by using Chi-square test. (P) value ≤ .05 was considered as statistically significant.
Results
|
Clinical parameters |
Lean |
Obese |
p value |
|
Number of patients |
100 |
100 |
|
|
Age in years (Mean ± SD) |
53.29± 8.33 |
53.36± 7.77 |
0.9511 |
|
Male/Female (%) |
69/31 |
42/58 |
|
|
Socioeconomic status |
|
|
|
|
Low |
78 |
41 |
|
|
Middle and high |
22 |
59 |
|
|
Duration of diabetes at presentation in months (Mean ± SD) |
69.85 ± 58.80 |
73.68 ± 63.93 |
0.6597 |
|
Family history of diabetes mellitus (%) |
52 |
70 |
|
|
History of smoking (%) |
32 |
24 |
|
|
History of alcohol (%) |
12 |
5 |
|
|
Use of Insulin (%) |
36 |
24 |
|
|
Systolic blood pressure |
114.2 ± 17.66 |
140.24 ± 20.27 |
< 0.0001 |
|
Diastolic blood pressure |
80.36± 7.92 |
90.4 ± 12.73 |
< 0.0001 |
|
BMI in kg/m2 (Mean ± SD) |
17.59 ± 0.368 |
28.24 ± 1.07 |
< 0.0001 |
|
Waist circumference in cm (Mean ± SD) |
73.89 ± 1.96 |
95.18 ± 4.12 |
< 0.0001 |
|
Microvascular complications of DM |
|
|
|
|
Neuropathy (%) |
46 |
28 |
|
|
Retinopathy (%) |
33 |
24 |
|
|
Albuminuria (%) |
35 |
36 |
|
|
Macrovascular complications of DM |
|
|
|
|
Coronary artery disease (%) |
9 |
12 |
|
|
Peripheral vascular disease (%) |
6 |
5 |
|
|
Stroke (%) |
4 |
5 |
|
|
Parameters |
Lean |
Obese |
p value |
|
Triglyceride in mg % (Mean ± SD) |
190.86 ± 37.44 |
241.7 ± 84.63 |
< .0001 |
|
High density lipoprotein in mg % (Mean ± SD) |
41.17 ± 4.99 |
40.23 ± 6.44 |
.2500 |
|
HbA1c |
9.818 ± 1.95 |
9.053 ± 1.99 |
.0066 |
|
Fasting serum insulin level in µIU/ml (Mean ± SD) |
6.404 ± 2.24 |
23.82 ± 2.04 |
< .0001 |
|
Fasting serum C-Peptide level in ng/ml (Mean ± SD) |
2.14 ± 0.35 |
2.48 ± 0.29 |
< .0001 |
Out of two hundred patients of diabetes, one hundred were kept in lean group and one hundred in obese group. In lean and obese groups, the mean age was 53.29± 8.33 (range: 37-67years) versus 53.36± 7.77 (range: 37-72 years) with mean duration of diabetes mellitus (in months) of 69.85 ± 58.80 (range: 1month-15 years) versus 73.68 ± 63.93 (range: 1 month-18 years). The duration of diabetes mellitus and age at presentation, were similar between both the groups ([Table 1]). The male and female ratio was 69/31 versus 42/58 between lean and obese groups respectively with a male predominance, 69% of patients being male in lean group compared to a female predominance (58%) in obese group. When comparing the lean and obese diabetic patients, 78% of lean patients belonged to low socioeconomic status compared to 41 % in obese group. Family history of diabetes mellitus in a first degree relative, was reported in 52% of patients in lean group and 70 % of patients in obese group. In lean diabetes group, 12% were alcoholics and 32% had history of chronic smoking which was higher compared to 5% and 24% respectively, in obese diabetes group. In lean group, mean BMI was 17.59 ± 0.368 which was much lesser compared to 28.24 ± 1.07 in the obese group (p-value < 0.0001). In obese group, the mean waist circumference (WC) was 95.18 ± 4.12 while in the lean group it was 73.89 ± 1.96 (p-value < 0.0001). No one had central obesity in the lean group but central obesity was observed in all the patients of obese group (WC ≥ 90 cm in male and ≥ 80 cm in female). For glycaemic control, insulin was used by 36% patients of lean group while only 24% of patients used insulin in obese group. Thus, higher number of patients used insulin in lean group in comparison to obese group. Obese diabetic patients had higher blood pressure readings as compare to the lean group. The average systolic and diastolic blood pressure readings were 140 and 90 for obese patients versus 114 and 80 for lean patients (p-value < 0.0001). The prevalence of microvascular complications of diabetes mellitus, was higher in lean group as compare to macrovascular complications. Peripheral neuropathy was observed in 46% of patients in lean group while 28% patients had peripheral neuropathy in obese group. Similarly, 33% of patients of lean group had diabetic retinopathy while 24% patients had diabetic retinopathy in obese group. The coronary artery disease (CAD) was prevalent in higher number (12%) in the obese group as a macrovascular complication of diabetes in comparison to the lean group (9%).
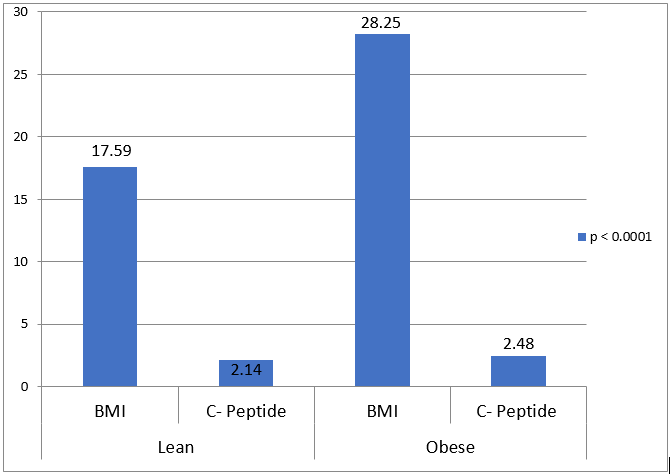
Obese diabetic patients had higher serum triglyceride level as compare to the lean group. The average triglyceride level was 241mg % for obese patients and 190 mg % for lean patients (p-value < 0.0001). There was no much difference in average serum level of high-density lipoprotein (HDL) between lean and obese groups of patients. In lean group, mean serum insulin level was 6.404 ± 2.24 which was much lower compared to 23.82 ± 2.04 in the obese group (p-value < 0.0001).([Figure 1], [Figure 2])
Discussion
In lean diabetes mellitus patients, usually there might be a history of some clinical characteristics like poor socioeconomic status, childhood malnutrition, and intrauterine growth retardation. In the obese people, the growing obesity causes insulin resistance and it results into development of diabetes mellitus when beta cells are unable to handle the insulin resistance. In lean people, there is much lower insulin resistance and development of diabetes occurs due to early failure of beta cells. Defective pancreatic insulin secretion is fundamental problem for hyperglycaemia in lean diabetes patients and reduced beta cell mass is contributory for it. [12] MM Ahuja coined the term “Ketosis Resistant Diabetes of the Young (KRDY)” for young type 2 diabetes patients with age at onset less than 30 years. The clinical characteristics of these patients are similar to lean diabetic patients but lean diabetic patients of our study had a higher age of diagnosis of diabetes mellitus. In our study patients, the mean age was 53 years in both obese and lean group but Coleman NJ and co-workers reported mean age of 50 years and 49 years for lean and obese patients respectively and Das and co-workers reported mean age of 48 years in lean diabetic patients. [13] Both active and passive smoking are independently and positively associated with risk of development of diabetes. [14] Apoptosis and dysfunction of pancreatic beta cells take place as a result of chronic alcohol consumption. [15] There was higher prevalence of alcoholism (12%) and smoking (32%) in lean group as compare to obese group and it was consistent with the Chicago study. In our study, there was much higher prevalence of males (69%) in lean diabetes group as compare to obese diabetes group (42%) and it was consistent with the studies conducted by Alemu S and co-workers and Fekadu S and co-workers. [16], [17] In comparison to females, the male preponderance in lean diabetic patients may be due to unhealthy life style or some kind of genetic defect that can be responsible for beta cell failure. This is considered as a matter of debate. It has been postulated that reduced beta cell function and defective insulin secretion in lean diabetic patients may be associated with some sort of genetic defect of ATP sensitive potassium channel Kir6.2 (or KCN JII) and transcription factor FL2 gene (TCFFL2) polymorphisms as compare to other type 2 diabetes mellitus patients. [18] Perry and co-workers conducted a study in 2012 among type 2 diabetes patients of European descent and demonstrated that leaner patients have a significantly higher genetic disposition to occurrence of diabetes as compare to obese diabetic patients. Their study showed the correlation between lean type 2 diabetic patients and genetic variants near the LAMA1 gene.
In lean diabetic patients, it has been hypothesized that there could be rapid failure of pancreatic beta cells to a certain extent in comparison to type 2 obese diabetes mellitus patients. Our study showed a higher prevalence of insulin use among lean diabetic patients (36%) as compare to obese diabetic patients (24%) and it was consistent with study conducted by Coleman NJ and co-workers who found insulin use 49% in lean diabetic group and 44% in obese diabetic group. Moreover, serum triglyceride level is independently correlated with insulin resistance and pancreatic beta cell function. [19] Hypertriglyceridemia has adverse effects on insulin sensitivity and islet beta cell function and low triglyceride level may be considered as indirect marker of lower insulin resistance. Our lean study patients had lower mean triglyceride level as compare to their obese counterparts and it was consistent with the Chicago study and study conducted by W.B. Chan and co-workers. [20] The central obesity is correlated with the degree of insulin resistance. [21] All patients in our obese study group, had central obesity (WC ≥ 90 cm in male and ≥ 80 cm in female) but none in the lean study group. So, insulin resistance does not appear to involve in development of diabetes in lean group of patients and it can be hypothesized that failure of beta cells could be the possible mechanism for development of diabetes in lean patients. This may be the reason for higher use of insulin in lean diabetic group as compare to obese diabetic group.
In the lean type 2 diabetes patients, the exact reason for assumed rapid beta cell failure is not known. Bala subramanyam and co-workers postulated that intrauterine growth retardation and malnutrition could affect development and growth of pancreatic beta cells in the KRDY population. [22] However, majority (78%) of our lean diabetic study patients belonged to low socioeconomic status and there might be possibility that deprivation of food and nutrition during the postnatal and intrauterine periods would have played a role in occurrence of diabetes.
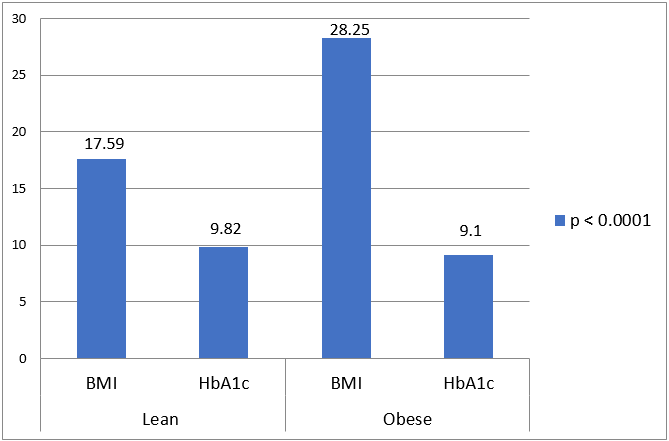
Our study showed higher HbA1c level among lean diabetic group in comparison to obese diabetic group. The microvascular complications were predominantly observed in lean diabetic patients as compare to obese diabetic patients. In lean diabetic patients, prevalence of peripheral neuropathy and retinopathy were observed 46% and 33% respectively and it was consistent with the results of peripheral neuropathy (70%) and retinopathy (25%) of a study performed by Barma and co-workers. There might be possibility that higher HbA1c and plasma glucose levels were responsible for it. Our study obese diabetic patients had higher blood pressure and coronary artery disease prevalence as compare to lean diabetic patients. The observations of study done by W.B. Chan et al and Chicago study, were in accordance with these findings of our study. The lean diabetic patients had higher HbA1c (poor glycaemic control). Despite of it they had a lower level of triglycerides, blood pressure and coronary artery disease events (adverse cardiovascular description) in comparison to obese diabetic patients.
In lean diabetic patients, fasting C-peptide levels tend to occur in-between type 2 and type 1 diabetes. [3] In our study patients, the mean fasting C-peptide level was lower in the lean group as compare to the obese group and it was consistent with studies done by Coleman NJ and co-workers and W.B. Chan and co-workers. There were appropriate fasting C-peptide levels in lean diabetic patients, denoting good beta cell reserve but significant lower levels of fasting insulin were observed in lean diabetic patients in comparison to obese diabetic patients. It can be explained by two hypotheses. The first possibility is of excessive ineffectual cycles of metabolism of carbohydrates and second possibility is of excessive extraction of insulin into porto-hepatic circulation due to raised glucokinase activity. [23] Conversely, obese diabetic patients had multiple cardiovascular risk factors, higher C-peptide level and lower HbA1c in comparison to lean diabetic patients advocating insulin resistance.
Our study had several limitations. The Islet cell antibodies (ICAs) were not analysed in lean diabetic patients. However, in type 1 diabetic patients the tyrosine phosphatase like protein (IA-2) and Glutamic acid decarboxylase (GAD) were found simultaneously in approximately 22% of cases while the prevalence of these antibodies in lean diabetic patients, were found to be approximately 4.7% only. [24] However, ICAs and GAD positivity have been observed in 4%-13% of obese diabetic patients. In our study patients, we excluded the possibility of type 1 diabetes mellitus and latent autoimmune of diabetes of adults (LADA) by presence of strong family history, the older age of diagnosis, high proportions of patients using only oral medications for longer duration. Although, higher HbA1c (glucose toxicity) may be responsible for low C-peptide state in lean diabetic patients in comparison to obese diabetic patients but the meal or glucagon-stimulated C-peptide level would be better for study point of view. There is need of randomised clinical trials to access utility of C-peptide level for providing individualized therapy to the diabetic patients and additional studies are required to discover immunological, hormonal, and metabolic characteristics among lean type 2 diabetes patients.
Conclusion
We can conclude that lean diabetic Indian patients in comparison to obese diabetic patients are distinguished by male predominance, poor socioeconomic status, excessive alcohol consumption, chronic smoker and more frequent user of insulin. In lean diabetic patient, non-traditional factors, deprivation of food and nutrition during the intrauterine and postnatal periods, and genetic predisposition may cause development of smaller beta cell mass that leads to marked beta cell failure and rapid exhaustion of beta cells. The lean diabetic Indian patients have lower C-peptide level and higher HbA1c (poor glycaemic control) in comparison to their obese counterparts. In obese diabetic patients, the goal of treatment should be optimization of all cardiovascular risk factors while for lean diabetic patients, we should have a low threshold to initiate insulin therapy.
Source of Funding
None.
Conflict of Interest
None.
References
- . International Diabetes Federation. IDF diabetes atlas. . 2015. [Google Scholar]
- . World Health Organization. The Asia-Pacific Perspective: Redefining Obesity and its Treatment. World Health Organization, Western Pacific Region. . 2000. [Google Scholar]
- George A, Jacob A, Fogelfeld L. Lean diabetes mellitus: an emerging entity in the era of obesity. World J Diabetes. 2015;6(4):613-20. [Google Scholar]
- Mohan V, Vijayaprabha R, Rema M, Premalatha G, Poongothai S, Deepa R. Clinical profile of lean NIDDM in South India. Diabetes Res Clin Pract. 1997;38(2):101-8. [Google Scholar]
- Thakural H, Kaur N, Mahajan D, Kaur HP, Bilkhu N. Prevalence of lean diabetes mellitus type 2. APICON. . 2009. [Google Scholar]
- Barma P, Ranabir S, Prasad L, Singh T. Clinical and biochemical profile of lean type 2 diabetes mellitus. Indian J Endocr Metab. 2011;15(1):40-3. [Google Scholar]
- Steiner D, Park S, Støy J, Philipson L, Bell G. A brief perspective on insulin production. Diabetes, Obesity and Metabolism. 2009;11(4):189-96. [Google Scholar]
- Khan H, Sobki S, Ekhzaimy A, Khan I, Almusawi M. Biomarker potential of C-peptide for screening of insulin resistance in diabetic and non-diabetic individuals. Saudi J Biol Sci. 2018;25(8):1729-32. [Google Scholar]
- Jones A, Hattersley AT. The clinical utility of C-peptide measurement in the care of patients with diabetes. Diabet Med. 2013;30(7):803-17. [Google Scholar]
- Cockram C. Diabetes mellitus: perspective from the Asia-Pacific region. Diabetes Res Clin Pract. 2000;50(2):3-7. [Google Scholar]
- Misra A, Vikram N, Gupta R, Pandey R, Wasir J, Gupta V. Waist circumference cutoff points and action levels for Asian Indians for identification of abdominal obesity. Int J Obes (Lond). 2006;30(1):106-11. [Google Scholar]
- Ritzel R, Butler A, Rizza R, Veldhuis J, Butler P. Relationship between beta-cell mass and fasting blood glucose concentration in humans. Diabetes Care. 2006;29(3):717-8. [Google Scholar]
- Coleman N, Miernik J, Philipson L, Fogelfeld L. Lean versus obese diabetes mellitus patients in the United States minority population. J Diabetes Complications. 2014;28(4):500-5. [Google Scholar]
- Zhang L, Curhan G, Hu F, Rimm E, Forman J. Association between passive and active smoking and incident type 2 diabetes in women. Diabetes Care. 2011;34(4):892-7. [Google Scholar]
- Kim J, Song E, Lee H, Oh Y, Park Y, Park J. Chronic ethanol consumption-induced pancreatic {beta}-cell dysfunction and apoptosis through glucokinase nitration and its down-regulation. J Biol Chem. 2010;285(48):37251-62. [Google Scholar]
- Alemu S, Dessie A, Seid E, Bard E, Lee P, Trimble E. Insulin-requiring diabetes in rural Ethiopia: should we reopen the case for malnutrition-related diabetes?. Diabetologia. 2009;52(9):1842-5. [Google Scholar]
- Fekadu S, Yigzaw M, Alemu S, Dessie A, Fieldhouse H, Girma T. Insulin-requiring diabetes in Ethiopia: associations with poverty, early undernutrition and anthropometric disproportion. Eur J Clin Nutr. 2010;64(10):1192-8. [Google Scholar]
- Saxena R, Gianniny L, Burtt N, Lyssenko V, Giuducci C, Sjögren M. Common single nucleotide polymorphisms in TCF7L2 are reproducibly associated with type 2 diabetes and reduce the insulin response to glucose in nondiabetic individuals. Diabetes. 2006;55(10):2890-5. [Google Scholar]
- Ma M, Liu H, Yu J, He S, Li P, Ma C. Triglyceride is independently correlated with insulin resistance and islet beta cell function: a study in population with different glucose and lipid metabolism states. Lipids Health Dis. 2020;19(1). [Google Scholar] [Crossref]
- Chan W, Tong P, Chow C, So W, Ng M, Ma R. The associations of body mass index, C-peptide and metabolic status in Chinese Type 2 diabetic patients. Diabet Med. 2004;21(4):349-53. [Google Scholar]
- St-Onge M, Janssen I, Heymsfield S. Metabolic syndrome in normal-weight Americans: new definition of the metabolically obese, normal-weight individual. Diabetes Care. 2004;27(9):2222-8. [Google Scholar]
- Balasubramanyam A, Yajnik C, Tandon N. Non-traditional forms of diabetes worldwide: Implications for translational investigation. Trans Endocrinol Metab. 2011;2(1):43-67. [Google Scholar]
- Das S, Siddharth N. Lean Type 2 Diabetes Mellitus: Profile, peculiarities and paradox. API textbook of Medicine. 2008. [Google Scholar]
- Goswami R, Kochupillai N, Gupta N, Kukreja A, Lan M, Maclaren N. Islet cell autoimmunity in youth onset diabetes mellitus in Northern India. Diabetes Res Clin Pract. 2001;53(1):47-54. [Google Scholar]
Article Metrics
- Visibility 8 Views
- Downloads 4 Views
- DOI 10.18231/pjms.v.15.i.1.137-142
-
CrossMark

- Citation
- Received Date February 07, 2024
- Accepted Date May 29, 2024
- Publication Date March 12, 2025