Panacea Journal of Medical Sciences
Panacea Journal of Medical Sciences (PJMS) open access, peer-reviewed triannually journal publishing since 2011 and is published under auspices of the “NKP Salve Institute of Medical Sciences and Research Centre”. With the aim of faster and better dissemination of knowledge, we will be publishing the article ‘Ahead of Print’ immediately on acceptance. In addition, the journal would allow free access (Open Access) to its contents, which is likely to attract more readers and citations to articles published in PJMS.Manuscripts must be prepared in accordance with “Uniform requiremen...
Evaluation of macular thickness in myopic patients using optical coherence tomography
Abstract
Aim and Objective: To study correlation of macular thickness with degree of myopia using spectral domain optical coherence tomography (OCT).
Materials and Methods: A prospective observational study on 159 eyes of 85 patients with axial myopia at Ophthalmology Department of tertiary care hospital for eighteen months.
Axial length (AXL) of myopic patients between 18-30yrs age was calculated with a scan biomicroscope. These patients were subjected to OCT and macular thickness was calculated.
SPSS version 23.0 was used for statistical analysis. AXL and macular thickness correlation was done using Pearson correlation test.
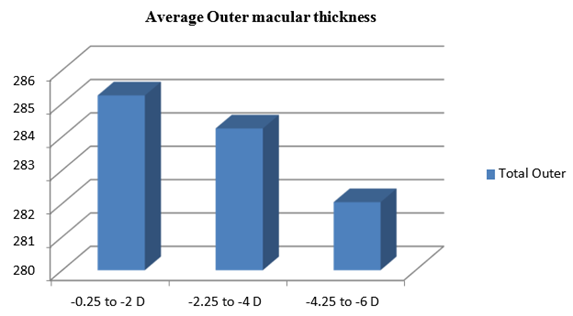
Results: No significant difference in mean AXL in relation with age. Significant increase in AXL with increase in degree of myopia. Total macular thickness has no significance with increase in degree of myopia. Central foveal thickness significantly increased with increase in spherical equivalent (p<0.001). Average outer macular thickness decreased as degree of myopia increased with no statistical significance. For myopia between -0.25 to -2 D, the average outer macular thickness measured was 285.24 ± 9.66 µm, for myopia between -2.25 to -4 D it was 284.25 ± 9.06µm and for -4.25 to -6D it was 282.04 ± 4.64 µm. Correlation between AXL and central foveal thickness was positive and was statistically significant.
Conclusions: Central foveal thickness increased with age and total macular thickness was greater in males. With progression of degree of myopia and increase in AXL, central foveal thickness increased, while retinal thickness of outer macular region decreased as assessed by OCT.
Introduction
Myopia is one of the most common ocular disorders and a leading cause of visual impairment. In 2010, an estimated 27% of the world’s population was myopic, out of which 2.8% had high myopia.[1] The prevalence of pathological myopia varies in different geographic regions, with highest prevalence in Asian population.
There is correlation between axial length and refractive error. Excessive axial elongation causes Myopia or nearsightedness. Axial length increases with the degree of myopia, with average 2.3 D myopia for each 1mm elongation in axial length. [2]
Myopia is associated with various complications, like myopic macular degeneration (MMD), cataract, retinal detachment (RD), and open angle glaucoma (OAG) which may result in irreversible visual impairment. [3]
Histological research suggests that retina thins and degenerates, particularly at the posterior pole in myopic eyes.[4] Various signs of retinal changes in myopia can be examined on direct ophthalmoscopy, indirect ophthalmoscopy or fundus photography. But these modalities help only in qualitative analysis as they lack quantitative aspect.
Macular thickness measurement is crucial for assessing different ocular disorders that result in thickening or thinning of the macula. In vivo measurements of retinal thickness have been made possible due to modern imaging technology like Optical coherence tomography (OCT). Relationship between retinal thickness and myopia can be assessed to evaluate macular disorders in myopic eyes. [5]
OCT is useful in detecting early changes in macular thickness in patients who are mild to moderate myopes and in understanding the mechanism and factors that contribute to structural alterations in myopic eyes.
AXL and macular thickness, as determined by optical coherence tomography (OCT), have been related in a number of studies conducted on adults and children; however, little is known regarding the impact on young adults.
Thus, aim of this study is to observe the association of axial length and macular thickness with the degree of myopia and using OCT in young adults.
Materials and Methods
It is a prospective observational study conducted in Department of ophthalmology from January 2019 to December 2019 for a duration of 18 months in a teritiary care hospital. Study was conducted after the institutional ethical committee clearance (IEC No. 145) according to Declaration of Helsinki.
Inclusion criteria
The study included 159 eyes of 85 patients with axial myopia and those fulfilled the Myopic patients between 18 to 30 years of age with best corrected visual acuity of 6/6.
Exclusion criteria
Patients with ocular diseases other than myopia like media opacities, glaucoma, uveitis, retinal diseases, intra-ocular surgeries, diabetes mellitus, hypertension any systemic illness and patients with family history of glaucoma in first degree relatives were excluded from the study. adetailed historyhistory of spectacle usage, previous refractive or intra-ocular surgery was obtained and then the patients were subjected to routine ophthalmic evaluation.
Examination included
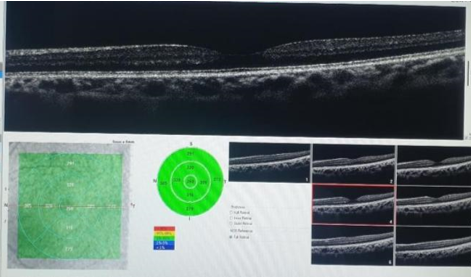
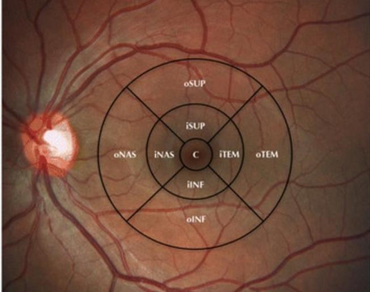
Auto kerato-refractometry, Best corrected visual acuity (BCVA). Subjective refraction of all the patients was done. Refractive error was expressed as spherical equivalent. Anterior segment evaluation was done and Intraocular Pressure (IOP) was measured for all cases using Non-contact tonometry. Fundus examination was done using direct and indirect ophthalmoscope. AXL measurement was done using A-scan biometry. The patients were subjected to OCT scan (Optovue Spectral Domain) and macular thickness was measured. The OCT provided 7-line high resolution raster and 6 × 6 mm retinal thickness map. Macula was divided into 9 regions with three concentric rings measuring 1 mm, 3 mm and 5 mm in diameter centred on the fovea over the retinal thickness map or ETDRS (Early Treatment of Diabetic Retinopathy Study) map. The 1 mm, 3mm, 5mm rings corresponds to the fovea, parafoveal and perifoveal areas respectively and were further divided as superior, inferior, nasal and temporal regions.[6] [[Figure 1], [Figure 2]]
Statistical analysis
The Statistical analysis was performed by SPSS 23.0 version. Percentages were taken for Categorical variables. Mean and variation of each observation from the mean value (Standard deviation) represented as mean±SD (analyzed using independent t test) was used to describe the continuous variables. Correlation between age and macular measurements was done using Pearson correlation test. Differences between macular measurements and age groups and refraction groups was done using One way ANOVA test with Tukey's post hoc test. Axial length and macular thickness correlation was done using Pearson correlation test. p value of <0.05 was taken as statistically significant.
Results
In a total of 159 eyes of 85 myopic patients in age group of 18 to 30 years, 45.3% were between 18 to 22 years, 37.1% between 23-26 years and 17.6% in 27-30 years. Out of 159 eyes, 105(66%) were males and (5434)% were females with Male:female ratio was 1.9:1.
Subjective refraction was done in all patients and SE was calculated. Out of total 159 eyes 56% had refractive error ranged (-0.25 to -2), 30.2% had (-2.25 to -4) and 13.8% (-4.25 to -6).[Table 1]
|
Refractive Error |
Number (Percentage) N=159 |
|
-0.25 to -2 D |
89 (56%) |
|
-2.25 to -4 D |
48 (30.2%) |
|
-4.25 to -6 D |
22 (13.8%) |
Patients having BCVA of 6/6 were included in our study. Of 159 eyes, 56 eyes (35.22 %) had uncorrected vision < 6/60, while the rest 103 eyes (64.78 %) had uncorrected vision >6/60 ([Table 2]).
|
Vision |
Number (Percentage) N=159 |
|
CF 3mt |
34 (21.38%) |
|
CF 6mt |
22 (13.84%) |
|
6/60 |
28 (17.61%) |
|
6/36 |
8 (5.03%) |
|
6/24 |
10 (6.29%) |
|
6/18 |
19 (11.95%) |
|
6/12 |
11 (6.92%) |
|
6/9 |
27 (16.98%) |
The mean AXL in males was 23.57 ± 0.87mm (N=105) and in females was 23.3 ± 3.35mm (N=54) with no significant difference.([Table 3])
|
Gender |
Males (N=105) Mean ± SD |
Females (N=54) Mean ± SD |
P value |
|
Axial Length (mm) |
23.57 ± 0.87 |
23.3 ± 3.35 |
0.574 |
The mean AXL of patients in age group 18-22yrs was (23.67 ± 0.88), 23-26yrs was (23.01±3.13) and 27-30 years was (23.98±1.06) with no significant difference in the mean axial length.([Table 4])
|
Age groups |
18-22yrs (N=72) Mean ± SD |
23-26yrs (N=59) Mean ± SD |
27-30yrs (N=28) Mean ± SD |
P value |
|
Axial Length (mm) |
23.67 ± 0.88 |
23.01 ± 3.13 |
23.98 ± 1.06 |
0.068 |
Eyes with myopia of -0.25 to -2D had mean AXL(22.76 ± 2.47)mm,-2.25 to -4D had (24.04 ± 0.51)mm and those with -4.25 to -6 D had (25.13 ±0.48)([Table 5]). There was a significant increase in the axial length with increase in the degree of myopia (p value<0.001)
|
|
-0.25 to -2 D (N=89) Mean ± SD |
-2.25 to -4 D (N=48) Mean ± SD |
-4.25 to -6 D (N=22) Mean ± SD |
P value |
|
Axial Length (mm) |
22.76 ± 2.47 |
24.04 ± 0.51 |
25.13 ± 0.48 |
<0.001 |
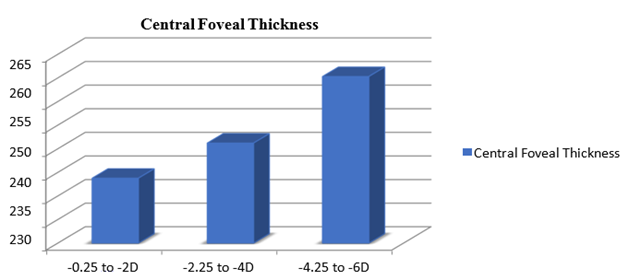
Macular measurements in each ETDRS sub-field in relation to degree of myopia are presented in [Table 6]. Total macular thickness did not show significant difference in relation with the increase in degree of myopia. Central foveal thickness showed significant increase with increase in SE(p<0.001). Central foveal thickness in patients with myopia (-0.25 to-2D) was 238.79±14.21µm, (-2.25 to-4 D) was 246.23±11.41µm and (-4.25to-6D) was 260.32 ± 20.85 µm ([Figure 4]).
Average inner macular thickness for myopia between (-0.25 to-2D) was 304.02±13.79µm, for (-2.25 to-4D) was 311.94±11.94µm and for (-4.25 to -6D) was 309.25±5.77µm. Average outer macular thickness decreased as the degree of myopia increased but was not statistically significant. For myopia between -0.25 to -2 D the average outer macular thickness measured was 285.24±9.66 µm, for myopia between -2.25 to -4 D it was 284.25±9.06µm and for -4.25 to -6D it was 282.04±4.64 µm. There was significant decrease in thickness of nasal outer and inferior outer macular thickness with the increase in degree of myopia.
|
Macular measurements |
-0.25 to -2 D (N=89) Mean ± SD |
-2.25 to -4 D (N=48) Mean ± SD |
-4.25 to -6 D (N=22) Mean ± SD |
P value |
|
Total macular |
288.42 ± 10.3 |
292.33 ± 9.82 |
291.72 ± 4.6 |
0.054 |
|
Central Foveal |
238.79 ± 14.21 |
246.23 ± 11.41 |
260.32 ± 20.85 |
<0.001 |
|
Average Inner |
304.02 ± 13.79 |
311.94 ± 11.94 |
309.25 ± 5.77 |
0.002 |
|
Temporal Inner |
293.47 ± 10.49 |
302.1 ± 13.27 |
299.91 ± 10.43 |
<0.001 |
|
Superior Inner |
304.63 ± 14.67 |
315.77 ± 12.97 |
312.18 ± 5.85 |
<0.001 |
|
Nasal Inner |
309.57 ± 14.14 |
321.65 ± 16.71 |
318.55 ± 7.28 |
<0.001 |
|
Inferior Inner |
308.39 ± 33.67 |
308.25 ± 12.02 |
306.36 ± 6.45 |
0.947 |
|
Average Outer |
285.24 ± 9.66 |
284.25 ± 9.06 |
282.04 ± 4.64 |
0.32 |
|
Temporal outer |
270.51 ± 8.51 |
268.48 ± 10.67 |
270.05 ± 9.54 |
0.479 |
|
Superior Outer |
284.67 ± 11.27 |
284.58 ± 10.79 |
289.45 ± 7.35 |
0.149 |
|
Nasal Outer |
304.73 ± 13.01 |
304.44 ± 10.98 |
297.41 ± 7.19 |
0.03 |
|
Inferior Outer |
281.06 ± 9.12 |
279.52 ± 9.3 |
271.27 ± 10.14 |
<0.001 |
Correlations between Axial Length and thickness of the macula in each of nine quadrants are shown in [Table 7]. Correlation between axial length and central foveal thickness was positive and was statistically significant (p value 0.004).
|
Macular Thickness |
R value |
P value |
|
Central Foveal Thickness |
0.227 |
0.004 |
|
Temporal Inner |
0.178 |
0.025 |
|
Superior Inner |
0.143 |
0.072 |
|
Nasal Inner |
0.156 |
0.051 |
|
Inferior Inner |
0.031 |
0.697 |
|
Temporal outer |
0.1 |
0.209 |
|
Superior Outer |
0.128 |
0.107 |
|
Nasal Outer |
-0.004 |
0.956 |
|
Inferior Outer |
-0.111 |
0.164 |
|
Total Thickness |
0.14 |
0.079 |
|
Total Inner |
0.142 |
0.073 |
|
Total Outer |
0.033 |
0.683 |
Correlation between average inner macular thickness and average outer macular thickness with axial length was also positive but was not statistically significant. Only nasal outer macula and inferior outer macula had negative correlation with axial length which was also not statistically significant.
Discussion
Myopia is one of the most common ocular abnormalities worldwide and is a major concern due to its increasing rate of incidence, high prevalence and associated ocular complications. Infrared light with lower coherence interference is used in OCT and measures tissues with good resolution. Retinal thickness can be measured precisely with OCT. OCT measurements helps the clinicians to understand the changes in retinal thickness in myopes and thus making it easy for interpretation of various retinal thickness nomograms. [5]
In this study, 159 eyes of 85 myopic patients in the age group of 18 to 30 years were studied. Out of this 45.3 % were between 18 to 22 years which is similar to studies done by Zhao M et al[7] and Ayoob M et al [8].In the present study 66% were males and 34% were females (males: female – 1.9 :1). In studies done by Sood RS et al[9] Vitale S et al[10] the prevalence of myopia in women was higher (40%) compared with men (33%) but in 20-39years age group. The present study cannot be compared with the studies by Sood RS et al[9] and Vitale S et al[10] as prevalence was not calculated in the present study.
Holden et al[11] in his study suggested that environmental factors such unequal access to education, physical activity and close work contribute to gender variability.
This study shows 56% of the eyes with spherical equivalent (SE) between -0.25 to -2, followed by 30.2 % between -2.25 to -4 and 13.8% had -4.25 to -6. Mean SE was -2.41±1.38 in the age group of 18 to 30 years. In a similar study, Zhao Z et al[12] in age group of 16 to 35 years found mean SE to be -1.63± 0.89 in mean age group of 22.59±5.17 and -4.59± 0.93 for mean age group of 22.90±5.46.
In our study the mean axial length (AXL) in males was 23.57 ± 0.87mm (N=105) while in females it was 23.3 ± 3.35mm (N=54). Mean AXL of patients in age group of 18-22 years was 23.67 ± 0.88, in 23-26 years was 23.01 ± 3.13 and in 27-30 years group it was 23.98 ± 1.06.There was no significant difference in the mean axial length in relation with the age and gender. This is agreement with the study done by Warrier et al and Olsen T et al. [13], [14]
In our study, AXL increased as the age of patients increased which is in contradiction to the studies done by Das P et al[15] and Warrier et al.[13] where it was observed that Older people were likely to have shorter AXL than younger participants in their studies and these differences were related to cohort effects.
Total macular thickness in this study showed no significant difference in relation with increase in degree of myopia. However, central foveal thickness showed a significant increase with increase in spherical equivalent. The average outer macular thickness decreased as the degree of myopia increased but it was not statistically significant. These findings of our study were similar to the results in studies done by Luo HD et al and Chen et al. [16], [17]
Similarly, a study done by Lam et al[18] showed that total macular thickness decreased with negative spherical equivalent which was significant in outer macular region and average foveal thickness increased with increasing negative spherical equivalent.
Othman S et al [19] in their study showed that outer macular thickness in myopic subjects of refractive error of -8.00 D is thinner by about 20.22 mm (8.6%) (Average of the three quadrants, excluding the nasal area) than emmetropic subjects, while there is increase in thickness of central fovea by about 19.09 mm (9.3%).
The present study showed a significant increase in AXL with increase in degree of myopia. In a study by Das P et al[15] it was observed that AXL was more in high degree than in low degree myopic eye and difference in mean axial in three groups (low degree, moderate degree and high degree) was found statistically significant. Chang SW et al[20] also found similar correlation of AXL with degree of myopia.
Study done by Hashemi H et al[21] suggested that the AXL was correlated more strongly with spherical equivalent in eyes with moderate to severe myopia.
In this study, Correlation between AXL and central foveal thickness was positive and statistically significant. There was a negative correlation between the AXL and nasal outer and inferior outer macular thickness which was not statistically significant. Sarhan AR et al[22] had done a study which revealed that fovea was the only quadrant to show statistically significant positive correlation (an increase in thickness with increasing AXL) which was similar to our study also there was a negative correlation with the inner and outer macular region. Study done by Luo HD et al. [16] suggested that the minimum macular thickness at fovea increased and the overall macular thickness decreased with increasing AXL and refraction. Othman S et al[19] found that there was high statistically significant correlation between increasing foveal thickness with increasing AXLs and increasing SEs.
Several theories are proposed to support correlation of macular thickness with AXL and SE suggesting that there is increase in foveal thickness. A correlation was found between AXL and macular thickness which was negative in all quadrants of macula except for fovea and outer temporal quadrant. SE was positively correlated with thickness in overall macular area except for outer temporal quadrant. [22] A plausible explanation could be that an increase in the AXL leads to mechanical stretching of the sclera in posterior pole. The parafoveal region is more elastic and therefore undergoes stretching and thinning. The increase in foveal thickness in myopia can be an early sign of vitreoretinal traction and may be associated with retinal detachment, myopic maculopathy, and foveoschisis which are not yet detected by OCT. [6]
Limitations
In the present study, macular thickness along the vertical and the horizontal scans was assessed. Retinal pathology related to myopia can occur in the regions other than macula. Using a three-dimensional volume scan protocol which covers total macular area is useful in overcoming this limitation.
This study used limited age range of the subjects which is a limitation of this study and including elderly subjects in the study would improve the knowledge off the macular changes in different parts and layers of macula.
Conclusion
Myopia is a highly prevalent ocular disorder worldwide and is a leading cause of visual impairment. Its increasing incidence and ocular complications make it a major concern.
Availability of modern imaging technology like Optical coherence tomography (OCT), helps in vivo measurements of retinal thickness and the relationship between myopia and retinal thickness can be assessed.
There is increase in central foveal thickness and decrease in outer macular retinal thickness with progression of degree of myopia and increase in axial length. Axial elongation of the globe in myopics is associated with thinning of retina in the equatorial and pre-equatorial regions and thickening of central fovea showing that axial elongation takes place in the equatorial and pre-equatorial regions of eye.
These findings of our study may help in improving the interpretations of the results of OCT testing during diagnosis and management of ocular diseases associated with young myopic population.
Conflicts of Interest
None.
Source of Funding
None.
References
- Fricke T, Jong M, Naidoo K, PS, Naduvilath T, Ho S. Global prevalence of visual impairment associated with myopic macular degeneration and temporal trends from 2000 through 2050: systematic review, meta-analysis and modelling. Br J Ophthalmol. 2018;102(7):855-62. [Google Scholar]
- Mutti D, Hayes J, Mitchell G, Jones L, Moeschberger M, Cotter S. Refractive error, axial length, and relative peripheral refractive error before and after the onset of myopia. Invest Ophthalmol Vis Sci. 2007;48(6):2510-9. [Google Scholar]
- Haarman A, Enthoven C, Tideman J, Tedja M, Verhoeven V, Klaver C. The Complications of Myopia: A Review and Meta-Analysis. Invest Ophthalmol Vis Sci. 2020;61(4). [Google Scholar] [Crossref]
- Yanoff M, Fine B. . Ocular Pathology: A Text and Atlas. 1989. [Google Scholar]
- Pedut-Kloizman T, Paktera H, Schuman J, Szwartz J, Hee M. Ophthalmic Diagnosis Using Optical Coherence Tomography. Ophthal Clin North Am. 1998;11(3):465-6. [Google Scholar]
- . Grading diabetic retinopathy from stereoscopic color fundus photographs--an extension of the modified Airlie House classification. ETDRS report number 10. Early Treatment Diabetic Retinopathy Study Research Group. Ophthalmology. 1991;98(5):786-806. [Google Scholar]
- Zhao M, Wu Q, Hu P, Jia L. Macular Thickness Assessed with Optical Coherence Tomography in Young Chinese Myopic Patients. J Ophthalmol. 2015. [Google Scholar] [Crossref]
- Muhammad A, Dawood Z, Mirza S, Ain Q. Refractive errors and their relation to age and sex. Med Channel. 2011;17(2):28-31. [Google Scholar]
- Sood R, Sood A. Influence of Gender on the Prevalence of Myopia in Young Adults. Int J Basic Appl Med Sci. 2012;2(1):201-4. [Google Scholar]
- Vitale S, Sperduto R, Ferris-III F. Increased prevalence of myopia in the United States between 1971-1972 and 1999-2004. Arch Ophthalmol. 2009;127(12):1632-9. [Google Scholar]
- Holden B, Fricke T, Wilson D, Jong M, Naidoo K, Sankaridurg P. Global prevalence of myopia and high myopia and temporal trends from. Ophthalmology. 2000;123(5):1036-42. [Google Scholar]
- Zhao Z, Zhou X, Jiang C. Effects of myopia on different areas and layers of the macula: a fourier-domain optical coherence tomography study of a chinese cohort. BMC Ophthalmol. 2015;15. [Google Scholar] [Crossref]
- Warrier S, Wu H, Newland H, Muecke J, Selva D, Aung T. Ocular biometry and determinants of refractive error in rural Myanmar: the Meiktila Eye Study. Br J Ophthalmol. 2008;92(12):1591-4. [Google Scholar]
- Olsen T, Arnarsson A, Sasaki H, Sasaki K, Jonasson F. On the ocular refractive components: the Reykjavik Eye Study. Acta Ophthalmol Scand. 2007;85(4):361-6. [Google Scholar]
- Das P, Das R, Shrivastava PK, Mondal A. A Clinical Study on the Correlation Between Axial Length, Intraocular Pressure and Central Corneal Thickness in Myopic Eyes. Int J Contemp Med Res. 2016;3(4):1141-4. [Google Scholar]
- Luo H, Gazzard G, Fong A, Aung T, Hoh S, Loon S. axial length, and OCT characteristics of the macula in Singaporean children. Invest Ophthalmol Vis Sci. 2006;47(7):2773-81. [Google Scholar]
- Chen S, Wang B, Dong N, Ren X, Zhang T, Xiao L. Macular measurements using spectral-domain optical coherence tomography in Chinese myopic children. Invest Ophthalmol Vis Sci. 2014;55(11):7410-6. [Google Scholar]
- Lam D, Leung, K, Mohamed S, Chan W, Palanivelu M, Li E. Regional variations in the relationship between macular thickness measurements and myopia. Invest Ophthalmol Vis Sci. 2007;48(1):376-8. [Google Scholar]
- Othman S, Manan F, Manan F, Zulkarnain A, Mohamad Z, Ariffin A. Macular thickness as determined by optical coherence tomography in relation to degree of myopia, axial length and vitreous chamber depth in Malay subjects. Clin Exp Optom. 2012;95(5):484-91. [Google Scholar]
- Chang S, Tsai I, Hu F, Lin L, Shih Y. The cornea in young myopic adults. Br J Ophthalmol. 2001;85(8):916-20. [Google Scholar]
- Hashemi H, Khabazkhoob M, Miraftab M, Emamian M, MS, Abdolahi-Nia T. Axial length to corneal radius of curvature ratio and refractive errors. J Ophthalmic Vis Res. 2013;8(3):220-6. [Google Scholar]
- Sarhan A, Zaky M, Hassan B. Determining the correlation between axial length/spherical equivalent and macular thickness in myopia. Menoufia Med J. 2020;33(2):534-9. [Google Scholar]
Article Metrics
- Visibility 7 Views
- Downloads 3 Views
- DOI 10.18231/pjms.v.15.i.1.174-179
-
CrossMark

- Citation
- Received Date February 28, 2024
- Accepted Date June 05, 2024
- Publication Date March 12, 2025